On October 8, 2026: price 163.23 USD, trend sideways, RSI 48.1, support 149.58, resistance 170.65. technical analysis of abnb stock. ABNB Stock Analysis — full…
By Elena Vance
October 9, 20264 min read
ABNB Stock Analysis
Airbnb’s shares rose 1.62% to $163.23, putting the travel platform above its 20-day average but still below its 50-day average—a mixed technical picture for international investors tracking a company exposed to cross-border travel demand. The stock has gained 1.72% over five trading days, while remaining down 2.64% over the past month. JournalArta had not covered Airbnb in the prior 14 days, making the shares a fresh subject for review.
Trend & Price Action
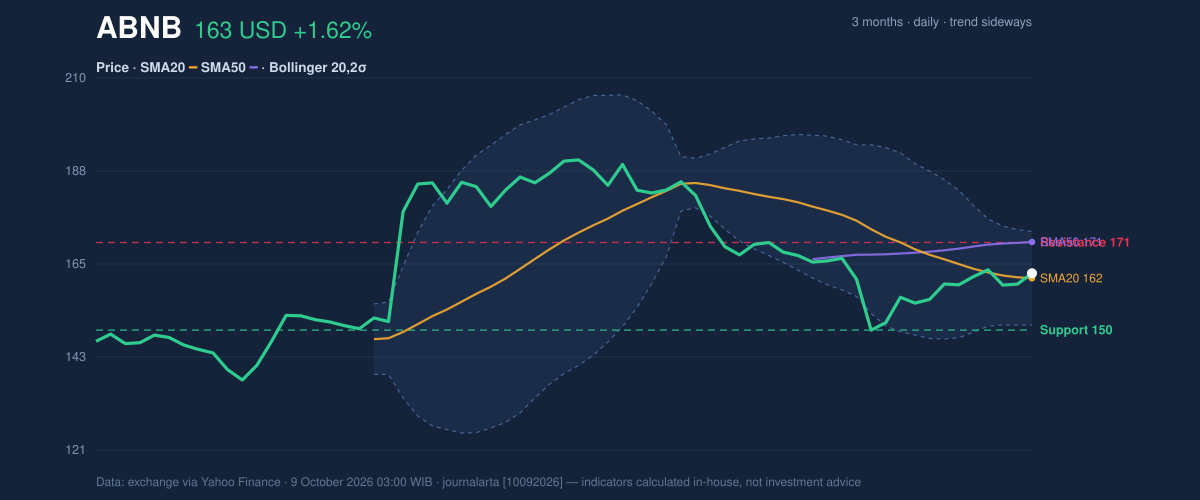
The latest move has not yet changed the broader sideways pattern. Airbnb’s price is above its $162.04 20-day simple moving average (SMA), a measure of the recent trading trend, but below its $170.76 50-day SMA. The shorter average’s slope is negative, down 2.06% over five trading days. That combination suggests a short-term rebound within a trend that has not yet turned convincingly higher.
There is no new moving-average crossover. In plain terms, the shorter-term trend has not crossed decisively above or below the longer-term one, so the averages offer no fresh confirmation of a directional shift. The share price sits at 65% of its 20-trading-day range, between support at $149.58 and resistance at $170.65. It is nearer the upper boundary, but has not cleared it.
As shown in the chart, the price is close to the Bollinger middle band and remains within the bands.
3-month price action chart of ABNB: price, SMA20/50, Bollinger, support & resistance. Data: exchange via Yahoo Finance.
Airbnb’s 3-month high and low are $193.45 and $135.72, respectively. The current price remains inside that wider range, reinforcing the picture of consolidation rather than a breakout.
Oscillators & Momentum
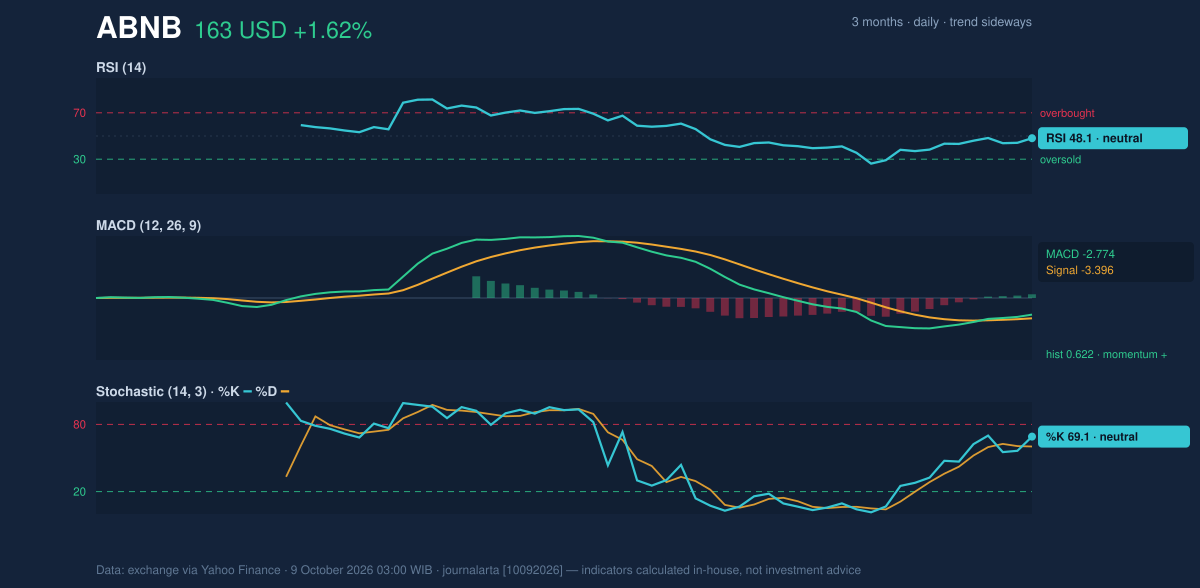
Momentum readings are improving in one measure, but they do not yet amount to broad confirmation. The RSI is 48.1, a neutral reading. The Relative Strength Index gauges the pace of recent gains and losses; near this level, it indicates neither strong buying pressure nor an oversold condition.
The Stochastic readings are also neutral, with %K at 69.1 and %D at 60.3. This indicator compares a closing price with its recent range. Its current readings point to firmer short-term positioning, but not an unambiguous signal of excessive momentum.
The MACD histogram is positive at 0.622, with MACD at -2.774 and its signal line at -3.396. The positive histogram means MACD is above its signal line, a sign that momentum has improved. Both lines remain below zero, however, tempering the bullish interpretation: the change is positive, but the wider momentum measure has not moved into positive territory.
Momentum chart of ABNB: RSI(14), MACD, Stochastic. Data: exchange via Yahoo Finance.
Volatility & Volume
The Bollinger bands—an indicator that places a range around a moving average—have a normal width of 13.9%, with the %B reading at 55%. That places the share price just above the band’s midpoint, not near either extreme. The upper and lower bands are $173.28 and $150.80, respectively, so the current position is consistent with contained trading rather than a sharp volatility expansion.
Average True Range, which estimates typical price movement, is $5.49, or 3.4% of the share price. That implies moderate daily volatility: movements can be meaningful, but the measure does not indicate unusually wide swings.
Trading volume was 3,450,400 shares, about 0.7 times the 20-day average of 4,734,375. The advance therefore came on lighter-than-usual participation. On-Balance Volume, which tracks whether volume accompanies rising or falling prices, is rising—an encouraging counterpoint, though lighter turnover limits how strongly the latest gain can be read as market-wide confirmation.
Key Levels & Scenarios
The first nearby test is resistance at $170.65, close to the 50-day average. A sustained move through that area would strengthen the case that the rebound is challenging the recent sideways structure; failure there would leave the shares caught between the short- and longer-term averages.
Below the market, support at $149.58 marks the lower boundary of the 20-trading-day range. The lower Bollinger band at $150.80 is another reference point nearby. A decline below support would weaken the current neutral setup, while holding above the $162.04 SMA20 would help preserve the short-term improvement.
Technical Verdict: HOLD
The technical verdict is HOLD (wait & see), reflecting conflicting signals rather than a confirmed trend.
Momentum is mixed: the MACD histogram is positive, but RSI and Stochastic remain neutral.
Price structure is unresolved: shares are above the SMA20 but below the SMA50, with no new moving-average crossover.
Participation is limited: volume is below its 20-day average, despite rising OBV.
The verdict is invalidated if the price falls below $149.58 support.
Illustrative entry range: $150.80–$162.04, between the lower Bollinger band and SMA20.
These levels translate the indicators into a neutral, wait-and-see reading; they are technical reference points, not investment advice.
The latest reported volume was 3,450,400 shares.
Summary Data ABNB
Last price
163.23 USD
Change 1 day / 5 days / 1 month
1.62% / 1.72% / -2.64%
Trend / MA-cross
sideways / none
SMA20 / SMA50
162.04 / 170.76
RSI (14) / Stochastic %K
48.1 / 69.1
Bollinger %B / ATR
55% / 5.49
Support / Resistance 20 days
149.58 / 170.65
Data as of
9 October 2026 03:00 WIB
Disclaimer: This technical analysis is generated automatically from exchange data (via Yahoo Finance) and indicators calculated by JournalArta, for information and education only. The verdict and the entry, target and stop-loss levels are not investment advice or a solicitation to buy or sell any security. Investment decisions and their risks rest solely with the reader.