ADBE Momentum Gains: Stock Gains 3.56% (October 8, 2026)
On October 8, 2026: price 241.05 USD, trend downtrend, RSI 45.8, support 231.01, resistance 265.60. technical analysis of adbe stock. ADBE Momentum Gains —…
Trend & Price Action
At $241.05, Adobe trades below its 20-day simple moving average (SMA20) of $243.22 and its 50-day average of $257.99. A simple moving average smooths daily price changes to show the prevailing direction; being below both generally indicates that sellers still have the stronger position over those periods. The 20-day average is also sloping down, falling 2.50% over five days. There has been no recent crossover between the averages to signal a change in trend. The price is near the lower portion of its 20-trading-day range, 29% of the way between support at $231.01 and resistance at $265.60. That location leaves room for a rebound, but proximity to support also makes the downside level important: a break below it would weaken the case that the latest move is a durable recovery. Over the past three months, the shares have ranged from $210.88 to $294.53. The daily jump is a counter-move until price proves otherwise.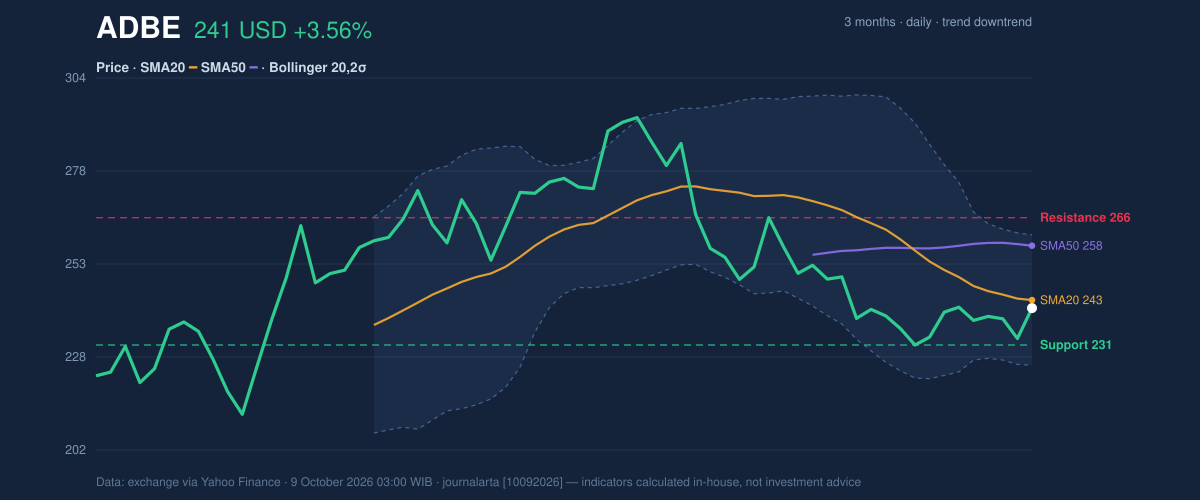
Oscillators & Momentum
Momentum indicators present a mixed picture. The RSI is 45.8, a neutral reading; the Relative Strength Index compares recent gains and losses, and this reading does not show either strong buying pressure or an oversold condition. The stochastic oscillator is also neutral, with %K at 54.6 and %D at 42.1. Its faster line is above the slower one, consistent with a near-term pickup, but not by itself evidence that the larger decline has ended. The MACD histogram has turned positive to 0.201, indicating that short-term momentum is improving relative to its signal line. Yet MACD remains negative at -6.157, while its signal line is -6.358. In plain terms, the recent momentum shift is constructive, but the indicator has not crossed into positive territory. That distinction matters: an improving decline can still be a decline.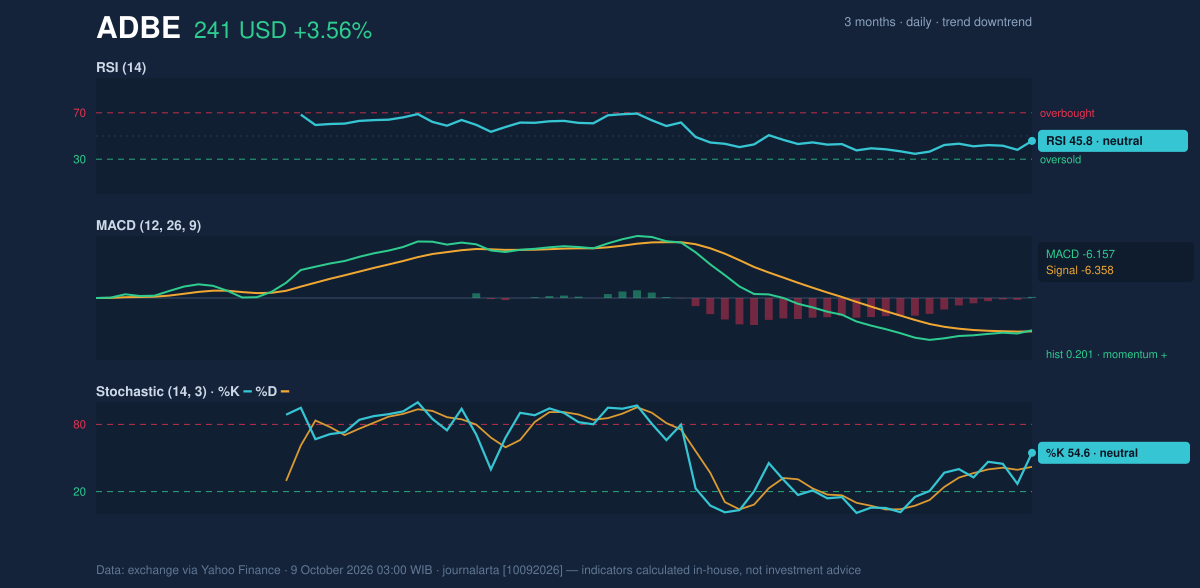
Volatility & Volume
Adobe’s Bollinger Bands are at normal width rather than tightly compressed or rapidly expanding. The bands run from $225.49 to $260.95, with a midpoint of $243.22; the share price’s position at 44% of the band places it below the midpoint, but not near the lower boundary. Bollinger Bands measure how far price has moved relative to recent volatility. A narrowing band can precede a larger move, while the current normal width offers no strong squeeze signal. Average True Range, a measure of typical price movement, is $8.20, or 3.4% of the share price, pointing to moderate volatility. Volume was 5,802,200 shares, about 1.1 times its 20-day average of 5,219,105. That above-average activity gives the daily rise more weight than a thinly traded bounce would have; rising OBV, a running measure of buying and selling volume, also suggests participation has improved. Neither confirms that the longer trend has turned.Key Levels & Scenarios
The first test is whether Adobe can regain and hold the $243.22 SMA20. A sustained move above that level would strengthen the short-term recovery case; the 50-day average at $257.99 and resistance at $265.60 are higher hurdles. If the price fails to hold $231.01 support, the recent rebound would be at risk, with the three-month low of $210.88 providing broader context rather than an immediate forecast.Technical Verdict: HOLD
The technical picture supports a wait-and-see stance, rather than a decisive directional call. The strongest reasons are the positive MACD histogram and rising OBV, countered by price below both moving averages and neutral RSI and stochastic readings. The verdict is invalidated if the price falls below $231.01 support.- Ideal entry range: $231.01–$243.22, bounded by 20-trading-day support and the SMA20.
- Exit target: $257.99–$265.60, using the SMA50 and 20-day resistance as reference levels.
- Stop-loss protection: Below $231.01, at the support boundary.
Data table: Last price $241.05 | SMA20 $243.22 | SMA50 $257.99 | RSI 45.8 | MACD histogram 0.201 | Support $231.01 | Resistance $265.60
Why ADBE is in focus today
- MACD histogram has just turned positive
- Not covered by JournalArta in the last 14 days
Selected automatically from 32 NASDAQ (US) stocks by a technical-signal score with daily weighted randomisation — not a recommendation.
Summary Data ADBE
| Last price | 241.05 USD |
| Change 1 day / 5 days / 1 month | 3.56% / -0.10% / -3.13% |
| Trend / MA-cross | downtrend / none |
| SMA20 / SMA50 | 243.22 / 257.99 |
| RSI (14) / Stochastic %K | 45.8 / 54.6 |
| Bollinger %B / ATR | 44% / 8.20 |
| Support / Resistance 20 days | 231.01 / 265.60 |
| Data as of | 9 October 2026 03:00 WIB |
Disclaimer: This technical analysis is generated automatically from exchange data (via Yahoo Finance) and indicators calculated by JournalArta, for information and education only. The verdict and the entry, target and stop-loss levels are not investment advice or a solicitation to buy or sell any security. Investment decisions and their risks rest solely with the reader.
Track ADBE stock price daily: live levels, support/resistance and our full ADBE analysis history.