CRWD Stock Analysis: Drops 0.92%, Momentum Weakens
On October 8, 2026: price 263.01 USD, trend uptrend, RSI 59.4, support 206.74, resistance 278.86. technical analysis of crwd stock. CRWD Stock Analysis — full…
Why CRWD is in focus today
- MACD histogram has just turned negative
- Not covered by JournalArta in the last 14 days
Selected automatically from 32 NASDAQ (US) stocks by a technical-signal score with daily weighted randomisation — not a recommendation.
Trend & Price Action
CrowdStrike remains in an uptrend. Its last price stands above the 20-day simple moving average (SMA) of $254.29 and the 50-day SMA of $226.91. A simple moving average smooths daily price changes; when the share price sits above both measures, it generally indicates that the prevailing trend is still upward. The 20-day average has risen 6.16% over five days, adding evidence that the recent trend has been strong. There has been no new moving-average crossover, however, so the data do not show a fresh long-term trend signal. The stock is up 25.93% over one month, but slipped 1.16% in five days. At $263.01, it is about 78% of the way through its 20-day trading range, between support at $206.74 and resistance at $278.86. That places the price closer to the upper boundary, where further gains would need to overcome resistance rather than simply recover from a deeper pullback. The three-month high is $286.99, while the low is $174.14. The broader trend is intact, but the shares are approaching a test.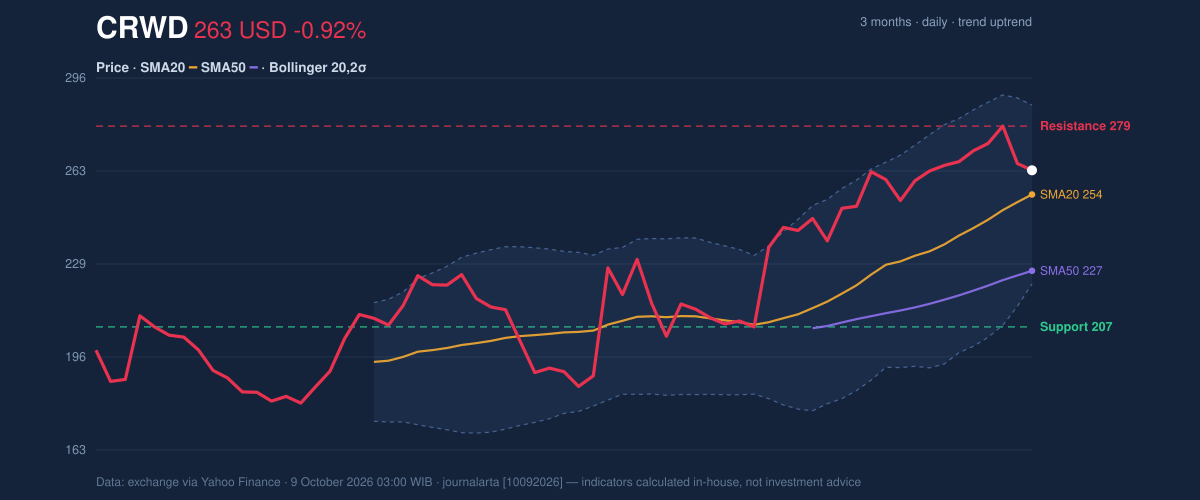
Oscillators & Momentum
The RSI, a measure of recent price momentum, is 59.4 and classified as neutral. The Stochastic readings are also neutral, with %K at 57.3 and %D at 68.1. Neither indicator currently signals an extreme condition. The gap between the Stochastic lines, with %K below %D, is consistent with softer near-term momentum, though it is not by itself proof that the broader advance has ended. The more direct caution comes from the MACD. Its reading of 13.548 is just below the 13.770 signal line, leaving a negative histogram of -0.223. MACD compares short- and longer-term price momentum; a negative histogram means the shorter-term measure has slipped below its signal, suggesting the advance has lost some force. It does not erase the rising trend, but it weakens the case that recent gains are being reinforced by momentum. RSI and Stochastic remain neutral, while MACD momentum has turned negative. That mix points to a pause or consolidation risk rather than a confirmed reversal.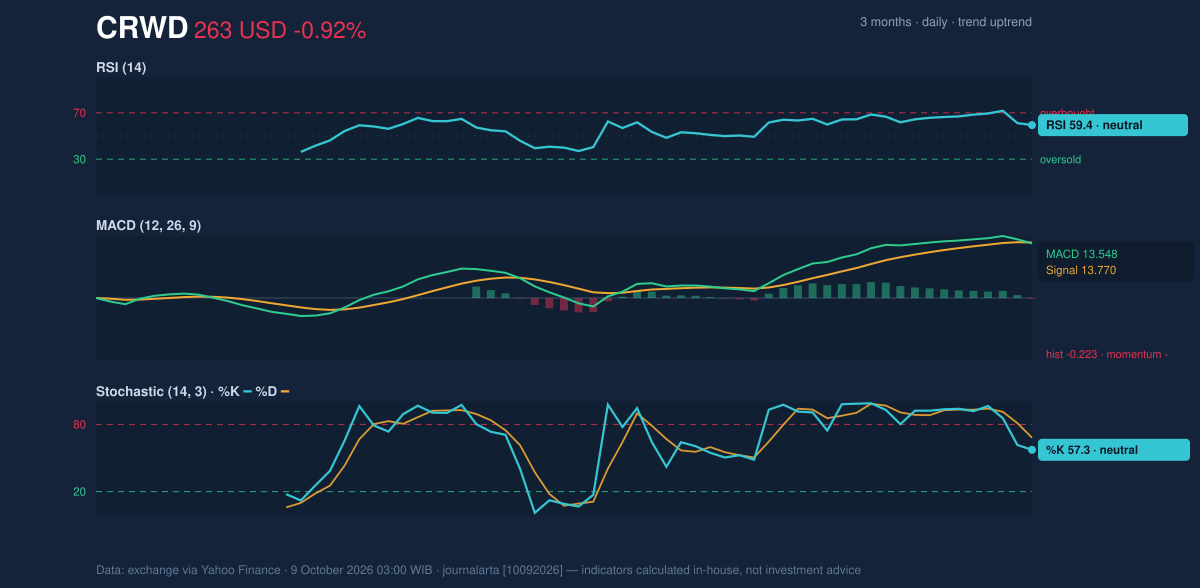
Volatility, Volume & Key Levels
CrowdStrike’s Bollinger Bands—bands that widen as recent price swings grow—span $222.19 to $286.40, with the middle band at $254.29. The 25.2% band width signals elevated volatility, and the 64% %B reading places the share price above the middle band but below the upper band. In other words, price remains in the upper half of its recent range, without yet reaching the band’s upper edge. The average true range (ATR), a measure of typical daily movement, is $10.73, or 4.1% of the share price, underscoring the potential for sizeable swings. The Bollinger Bands are widening, and ATR confirms high volatility. That makes a move toward resistance more consequential, but also means a pullback can travel quickly. Trading volume was 9,385,300 shares, about 0.9 times the 20-day average of 10,648,820. On-balance volume (OBV), which tracks whether volume is associated with rising or falling prices, is increasing. That offers some evidence of buying participation, although the latest below-average turnover provides less confirmation for the day’s price action. Resistance is $278.86; support is $206.74. A move through resistance would put the three-month high of $286.99 in focus. If the stock instead loses the $254.29 20-day average, that would weaken the near-term trend; a deeper failure would bring the $222.19 lower Bollinger Band into view. These are conditional reference points, not forecasts.Technical Verdict: HOLD (wait & see)
The indicators give mixed signals: the price remains above rising moving averages and OBV is climbing, but the MACD histogram has turned negative and volume is below its 20-day norm. High volatility makes that conflict harder to resolve from a single session. - Ideal entry range: $254.29–$263.01, spanning the 20-day average to the latest price. - Exit target: $278.86, the 20-day resistance level. - Stop-loss protection: $222.19, the lower Bollinger Band. - Invalidation: The verdict is invalidated if price falls below $254.29, the 20-day SMA. For non-traders, the chart still favors the established upward trend, but weakening momentum argues for waiting for clearer confirmation.| Market measure | Reading |
|---|---|
| Last price | $263.01 |
| Daily change | -0.92% |
| SMA20 / SMA50 | $254.29 / $226.91 |
| RSI(14) | 59.4, neutral |
| MACD histogram | -0.223, negative |
| 20-day support / resistance | $206.74 / $278.86 |
Summary Data CRWD
| Last price | 263.01 USD |
| Change 1 day / 5 days / 1 month | -0.92% / -1.16% / 25.93% |
| Trend / MA-cross | uptrend / none |
| SMA20 / SMA50 | 254.29 / 226.91 |
| RSI (14) / Stochastic %K | 59.4 / 57.3 |
| Bollinger %B / ATR | 64% / 10.73 |
| Support / Resistance 20 days | 206.74 / 278.86 |
| Data as of | 9 October 2026 03:00 WIB |
Disclaimer: This technical analysis is generated automatically from exchange data (via Yahoo Finance) and indicators calculated by JournalArta, for information and education only. The verdict and the entry, target and stop-loss levels are not investment advice or a solicitation to buy or sell any security. Investment decisions and their risks rest solely with the reader.
Track CRWD stock price daily: live levels, support/resistance and our full CRWD analysis history.