MSTR Stock Drops 1.24% on Thursday, Momentum Weakens
On October 8, 2026: price 151.47 USD, trend sideways, RSI 53.5, support 126.18, resistance 168.50. technical analysis of mstr stock. MSTR Stock Drops — full…
By Elena Vance
October 9, 20264 min read
MSTR Stock Drops 1.24% on Thursday, Momentum Weakens
Strategy fell 1.24% to $151.47 on Nasdaq on October 9, extending its five-day decline to 5.63%, even as the stock remains up 17.82% over the past month. The pullback has brought the price just below its 20-day average, while mixed momentum readings and elevated volatility leave the near-term trend unsettled. JournalArta has not covered the stock in the past 14 days, making this a fresh technical check—not a change in the company’s fundamentals.
Trend & Price Action
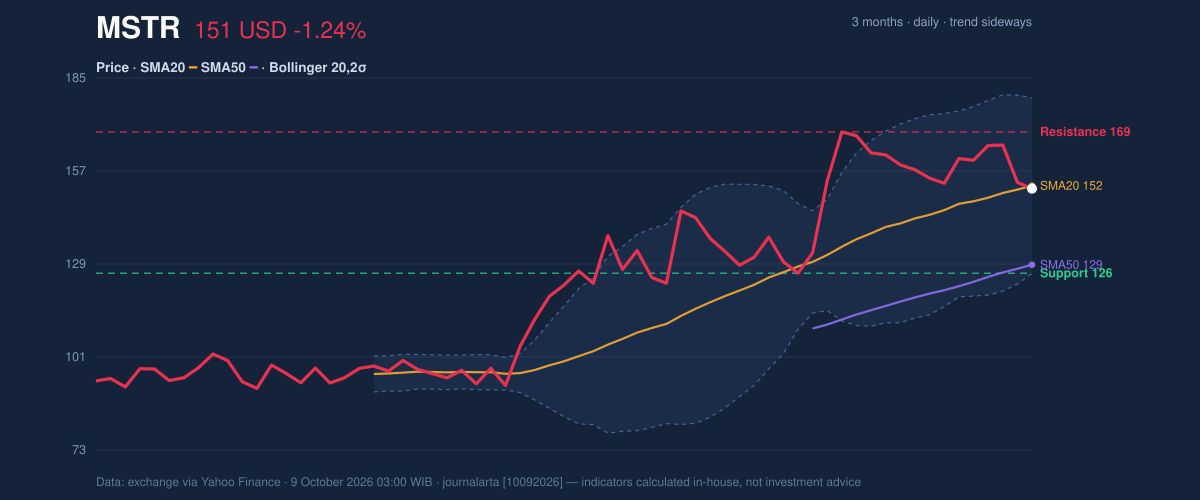
The shares closed below the 20-day simple moving average (SMA) of $152.37, a short-term reference for the recent price trend, but remain well above the 50-day SMA of $128.69. The 20-day average is still rising, up 3.69% over five trading days, and there has been no recent crossover between the two averages. Together, those signals describe a stock in a short-term pause within a stronger medium-term advance, rather than a confirmed trend reversal.
The broader range is wide: the three-month high is $171.19 and the low is $89.21. At about 60% of its 20-day trading range, Strategy is neither pressing against the reported resistance nor sitting near support. The latest close is also close to the middle Bollinger band, which tracks a moving average and its surrounding volatility range. Its position there offers little evidence of a decisive breakout in either direction.
As shown in the chart, the price sits just under the middle band and 20-day average, while the wider bands signal room for larger swings.
3-month price action chart of MSTR: price, SMA20/50, Bollinger, support & resistance. Data: exchange via Yahoo Finance.
Momentum & Volatility
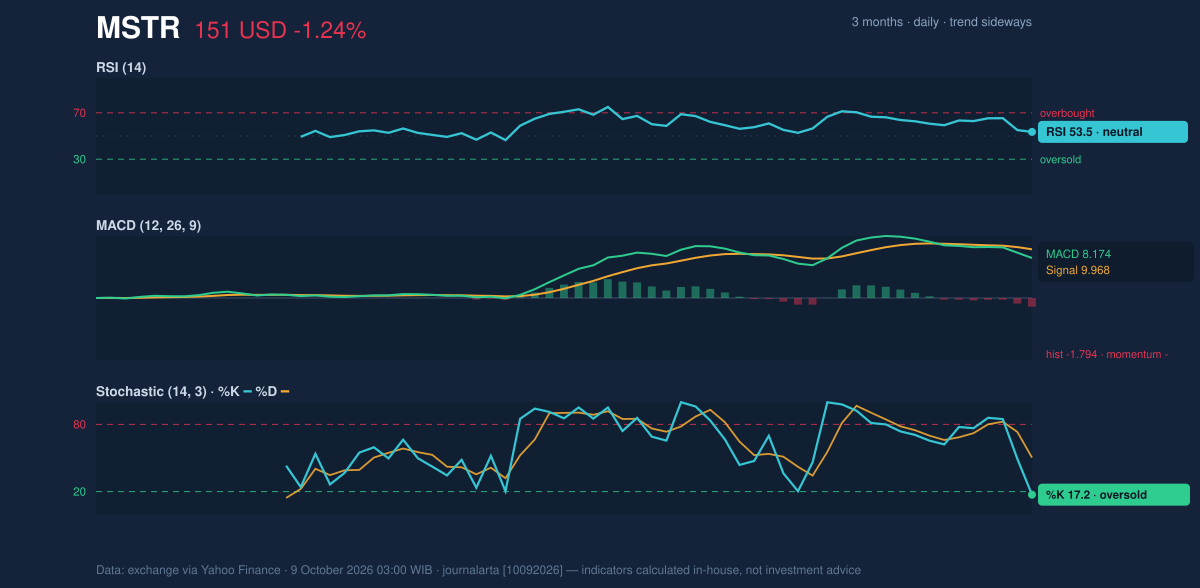
The momentum indicators do not tell one consistent story. The RSI is 53.5, a neutral reading on a scale used to gauge the pace of recent gains and losses. That points to neither strong buying pressure nor an already stretched decline. The Stochastic %K at 17.2 is in oversold territory, while %D stands at 50.3. This gap can reflect a sharp recent loss of momentum, but by itself does not establish that a rebound has begun.
The MACD histogram is negative at -1.794, with MACD at 8.174 below its 9.968 signal line. MACD compares short- and longer-term price averages; a negative histogram indicates weakening momentum, consistent with the five-day decline. The contrast between oversold Stochastic and negative MACD matters: one suggests selling may have run far in the short term, while the other says downward pressure has not yet clearly eased.
The Bollinger bands are widening, with a 34.5% band width and %B at 48%, close to the center of the range. Wider bands indicate higher volatility, not a directional signal. The ATR of $8.63, or 5.7% of the share price, reinforces that daily moves have been large. Volume was 23,624,800 shares, roughly in line with its 20-day average of 22,869,535, but falling OBV—an indicator that accumulates volume on rising sessions and subtracts it on falling ones—shows that participation has not confirmed the recent advance.
Momentum chart of MSTR: RSI(14), MACD, Stochastic. Data: exchange via Yahoo Finance.
Key Levels & Scenarios
The reported 20-day support is $126.18 and resistance is $168.50. A sustained move back above the $152.37 average would improve the short-term price structure; a move toward resistance would then test whether the one-month gain can regain traction. Conversely, a failure to hold the 20-day average would leave the stock exposed to a deeper retreat toward support. These are conditional reference points, not forecasts: the wide bands and elevated ATR mean levels can be crossed quickly.
Technical Verdict: HOLD (wait & see)
The indicators support a neutral stance because the rising 20-day average and price’s position above the 50-day average are counterbalanced by a close below the 20-day average, negative MACD momentum and declining OBV. Oversold Stochastic readings raise the possibility of a pause in selling, but do not yet confirm a turn.
- Ideal entry range: $126.18–$152.37, bounded by the reported support and 20-day SMA.
- Exit target: $168.50, the reported 20-day resistance.
- Stop-loss protection: Below $126.18, the reported 20-day support.
- Invalidation: This HOLD verdict is invalidated if the price breaks below $126.18.
For non-traders, HOLD means the chart has not yet resolved whether the recent pullback is a pause or a deeper reversal.
Data source: Nasdaq market data via Yahoo Finance, as of October 9, 2026, 03:00 WIB.
Summary Data MSTR
Last price
151.47 USD
Change 1 day / 5 days / 1 month
-1.24% / -5.63% / 17.82%
Trend / MA-cross
sideways / none
SMA20 / SMA50
152.37 / 128.69
RSI (14) / Stochastic %K
53.5 / 17.2
Bollinger %B / ATR
48% / 8.63
Support / Resistance 20 days
126.18 / 168.50
Data as of
9 October 2026 03:00 WIB
Disclaimer: This technical analysis is generated automatically from exchange data (via Yahoo Finance) and indicators calculated by JournalArta, for information and education only. The verdict and the entry, target and stop-loss levels are not investment advice or a solicitation to buy or sell any security. Investment decisions and their risks rest solely with the reader.