Lloyds Stock Analysis: Gains 0.34%, Momentum Gains
On October 14, 2026: price 104.75 GBp, trend downtrend, RSI 45.3, support 100.60, resistance 112.20. technical analysis of lloyds stock.
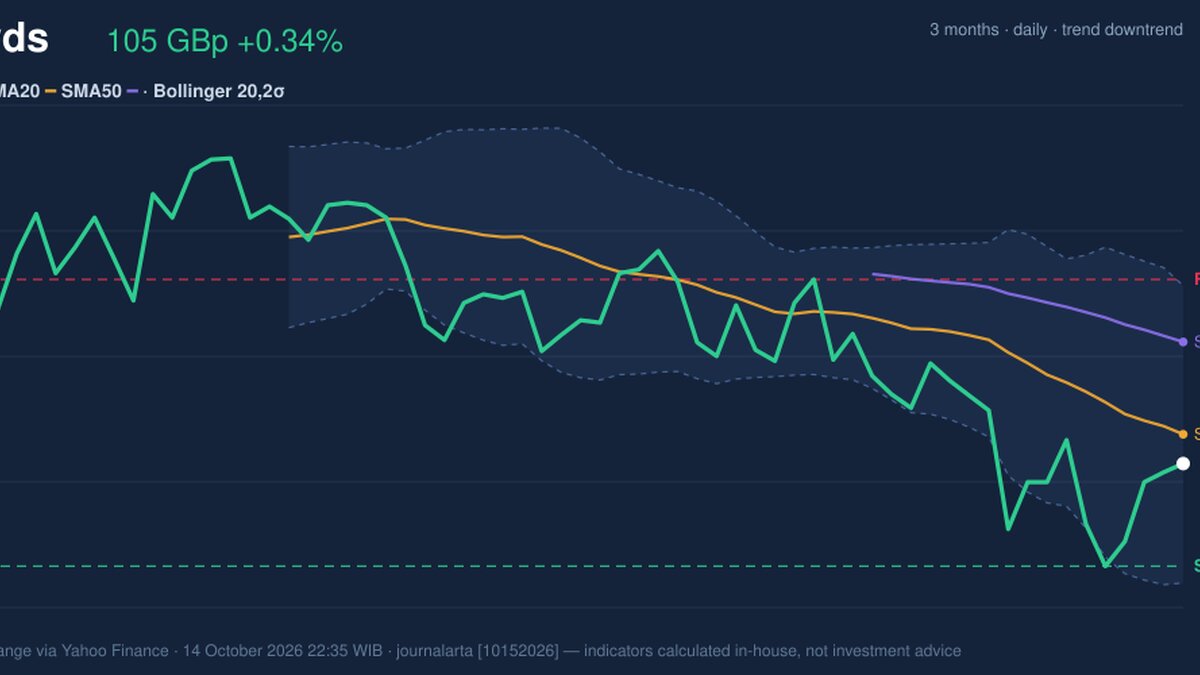
Why Lloyds is in focus today
- MACD histogram has just turned positive
Selected automatically from 16 LSE (UK) stocks by a technical-signal score with daily weighted randomisation — not a recommendation.
Trend & Price Action
At 104.75 pence, the shares are below the 20-day simple moving average (SMA) of 105.94 pence and the 50-day SMA of 109.67 pence. An SMA tracks the average closing price over a set period; when a share trades below both, it indicates that recent prices have not recovered to those averages. The 20-day average is also falling, with its slope down 1.60% over five trading days. There has been no new moving-average crossover, so the data offer no fresh signal that the short-term trend has turned upward or downward. The price is 36% of the way through its 20-trading-day range, between support at 100.60 pence and resistance at 112.20 pence. That location places it closer to support than resistance, though a level is not a guarantee that the price will stop there. As shown in the chart, the share price is below the Bollinger middle band, which coincides with the 20-day SMA. Bollinger Bands are a moving average with upper and lower bands that widen or narrow with price volatility. The current 40% position within the bands puts the price below the midpoint, while the normal 11.3% band width offers no squeeze signal of unusually compressed trading.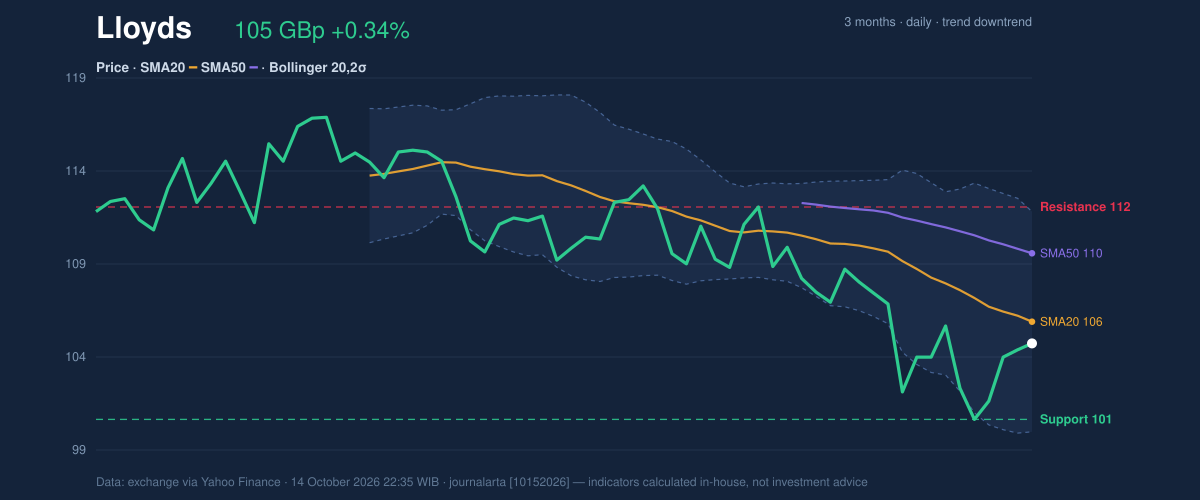
Oscillators & Momentum
Momentum indicators are mixed. The RSI is neutral at 45.3. The Relative Strength Index measures the pace of recent gains and losses; a neutral reading neither confirms strong buying pressure nor indicates that the shares are deeply oversold. The Stochastic %K at 95.4 is overbought, while %D stands at 61.4. This oscillator compares a closing price with its recent trading range. Its elevated %K reading suggests the recent bounce has been sharp relative to that range, making a pause or pullback possible even as the price remains below its moving averages. By contrast, the MACD histogram has just turned positive, at 0.055, with MACD at -1.896 and its signal line at -1.951. MACD compares shorter- and longer-term price averages; a positive histogram means the MACD line has moved above its signal line, hinting that downward momentum may be losing force. Both lines remain below zero, however, so the improvement is an early momentum signal rather than confirmation of a sustained uptrend.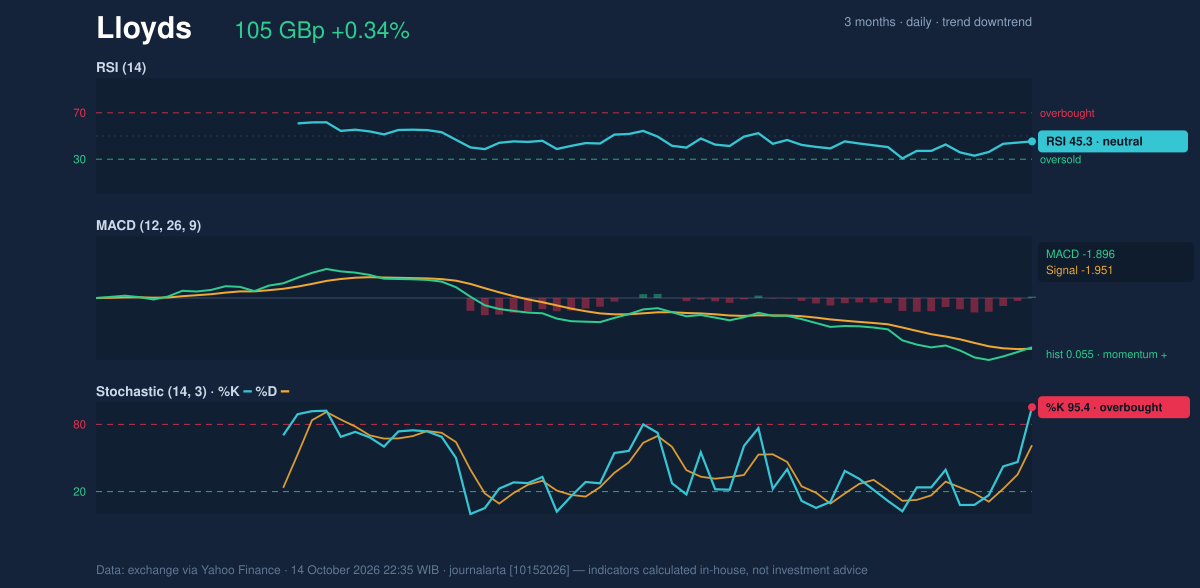
Volatility & Volume
Volatility remains a central risk in interpreting the bounce. Average True Range (ATR), a measure of typical price movement, is 9.84 pence, or 9.4% of the share price—high enough to make moves around technical levels less decisive. A brief move through support or resistance may therefore need confirmation rather than being treated as a clear break. Participation was limited: the latest volume of 41,343,960 shares was 0.3 times the 20-day average of 151,113,381, classified as thin. That weakens the confirmation provided by the recent rise. On the other hand, On-Balance Volume (OBV), which accumulates volume according to whether prices rise or fall, is rising. The divergence between rising OBV and low latest-session volume is constructive, but does not erase the lack of broad trading participation.Technical Verdict: HOLD (wait & see)
The indicators support a neutral wait-and-see verdict rather than a directional call: - The MACD histogram’s turn positive and rising OBV suggest selling pressure may be easing. - The price remains below the falling SMA20 and the SMA50, leaving the wider trend weak. - Overbought Stochastic readings and thin volume make the short-term bounce less convincing. The verdict is invalidated if the price falls below 100.60 pence, the stated 20-trading-day support. - Ideal entry range: 100.60–105.94 pence, bounded by support and the SMA20. - Exit target: 112.20 pence, the 20-trading-day resistance. - Stop-loss protection: below 100.60 pence, aligned with the stated support level. For non-traders, the signals are improving in one area but remain too mixed to confirm that Lloyds’ decline has reversed. Volume in the latest session was 41,343,960 shares, against a 20-day average of 151,113,381.Summary Data Lloyds
| Last price | 104.75 GBp |
| Change 1 day / 5 days / 1 month | 0.34% / 2.39% / -5.84% |
| Trend / MA-cross | downtrend / none |
| SMA20 / SMA50 | 105.94 / 109.67 |
| RSI (14) / Stochastic %K | 45.3 / 95.4 |
| Bollinger %B / ATR | 40% / 9.84 |
| Support / Resistance 20 days | 100.60 / 112.20 |
| Data as of | 14 October 2026 22:35 WIB |
Disclaimer: This technical analysis is generated automatically from exchange data (via Yahoo Finance) and indicators calculated by JournalArta, for information and education only. The verdict and the entry, target and stop-loss levels are not investment advice or a solicitation to buy or sell any security. Investment decisions and their risks rest solely with the reader.
Track Lloyds share price daily: live levels, support/resistance and our full Lloyds analysis history.