Unilever Stock Gains 2.52%, Testing Key Resistance In Focus
On October 14, 2026: price 4,829.00 GBp, trend sideways, RSI 64.8, support 4,483.50, resistance 4,829.00. technical analysis of unilever stock.
Why Unilever is in focus today
- Closed at a 20-day high (4,829.00)
- Breaking out of a Bollinger squeeze (band width 7.1%)
Selected automatically from 16 LSE (UK) stocks by a technical-signal score with daily weighted randomisation — not a recommendation.
Trend & Price Action
Unilever’s shares gained 4.46% over five days and 4.07% over one month, putting the recent advance against a broader sideways trend. The price is above its 20-day moving average (SMA20) of 4,639.05 GBp, while the SMA20 has edged higher. It remains above the 50-day average of 4,661.15 GBp, but there has been no new moving-average crossover. That combination suggests improving short-term tone, not yet a confirmed change in the wider trend. The closing price also matches the stated 20-day resistance, placing the share at the top of its recent range. Its position above the upper Bollinger band at 4,803.69 GBp, reflected in a %B reading of 108%, shows unusually strong price pressure relative to the band. It can accompany a breakout, but it can also mean the advance has run ahead of its recent average.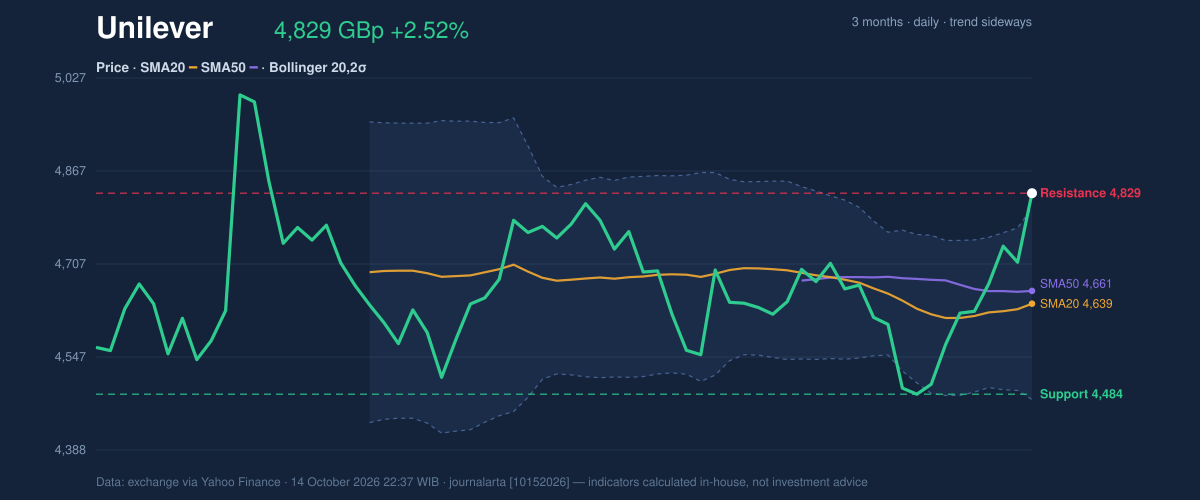
Oscillators & Momentum
Momentum is positive, though not uniformly comfortable. The MACD is positive at 15.288, with a positive 25.175 histogram; the histogram measures the gap between the MACD line and its signal line, so its positive reading indicates strengthening upward momentum. RSI at 64.8 remains in neutral territory, rather than confirming an extreme, while Stochastic %K at 100.0 and %D at 88.9 are overbought. Stochastic compares a close with its recent price range: readings this high show that the share has been closing near the top of that range, but also leave it more exposed to a pause.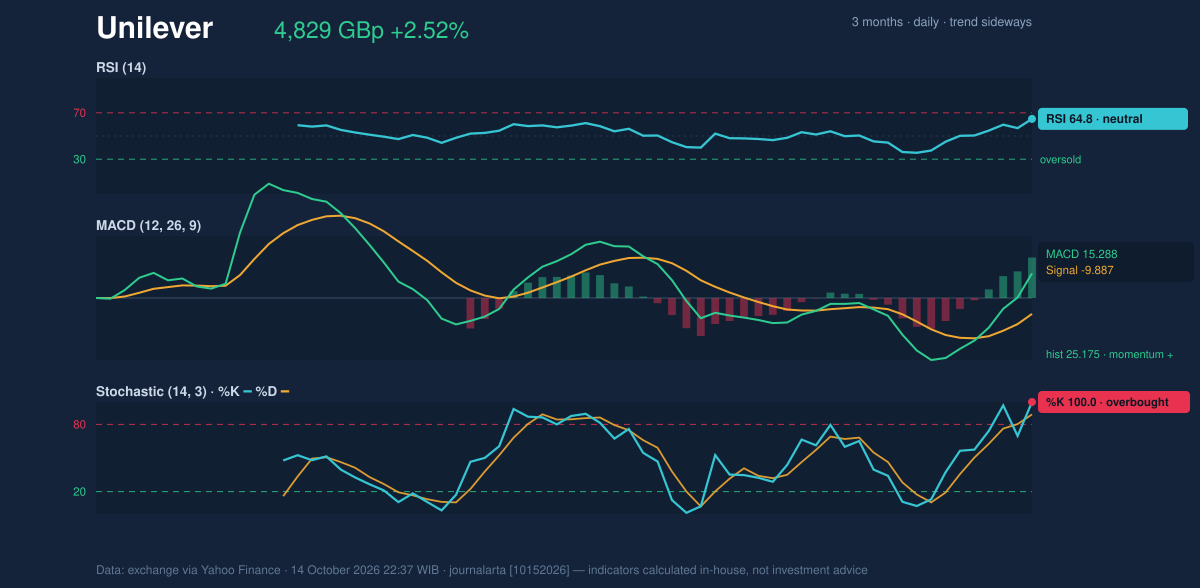
Volatility, Volume & Key Levels
The Bollinger width is 7.1% and is described in the data as narrowing, a squeeze that can precede a sharper move but does not identify its direction by itself. The price has now moved above the band’s upper edge, adding to the evidence of an attempted upward break. ATR, a measure of typical price movement, is 417.66 GBp, or 8.6% of the share price; that points to high volatility and cautions against reading a single close as a settled trend. Participation is the main weakness in the signal. Volume was 3,444 shares against a 20-day average of 2,992,100, marked as thin, even as OBV was rising. OBV tracks whether volume tends to accompany up or down sessions; its direction is supportive, but the very low latest turnover makes the day’s price action less persuasive as confirmation. The immediate level to watch is 4,829.00 GBp resistance, also the latest close and 20-day range high. A sustained move above it would strengthen the case that the squeeze has resolved upward. The listed 20-day support is 4,483.50 GBp; a failure to hold that area would undermine the recent constructive price action. The three-month low is reported as 0.00 GBp, which is not a useful trading reference in this dataset.Technical Verdict: HOLD (wait & see)
The indicators lean positive, but thin volume and overbought Stochastic readings leave the move short of a well-confirmed breakout. The core signal is constructive but unconfirmed.- Ideal Entry Range: 4,639.05–4,661.15 GBp, around the SMA20 and SMA50, if the price retreats while holding its broader structure.
- Exit Target (Target Price): 4,829.00 GBp, the stated resistance and 20-day high.
- Stop Loss protection: 4,483.50 GBp, the stated 20-day support.
Summary Data Unilever
| Last price | 4,829.00 GBp |
| Change 1 day / 5 days / 1 month | 2.52% / 4.46% / 4.07% |
| Trend / MA-cross | sideways / none |
| SMA20 / SMA50 | 4,639.05 / 4,661.15 |
| RSI (14) / Stochastic %K | 64.8 / 100.0 |
| Bollinger %B / ATR | 108% / 417.66 |
| Support / Resistance 20 days | 4,483.50 / 4,829.00 |
| Data as of | 14 October 2026 22:37 WIB |
Disclaimer: This technical analysis is generated automatically from exchange data (via Yahoo Finance) and indicators calculated by JournalArta, for information and education only. The verdict and the entry, target and stop-loss levels are not investment advice or a solicitation to buy or sell any security. Investment decisions and their risks rest solely with the reader.
Track Unilever share price daily: live levels, support/resistance and our full Unilever analysis history.