LSEG Stock Gains 0.57% on Wednesday, Momentum Gains
On October 14, 2026: price 8,398.00 GBp, trend sideways, RSI 49.7, support 8,090.00, resistance 8,760.00. technical analysis of lseg stock.
By Elena Vance
October 15, 20263 min read
LSEG Stock Gains 0.57% on Wednesday, Momentum Gains
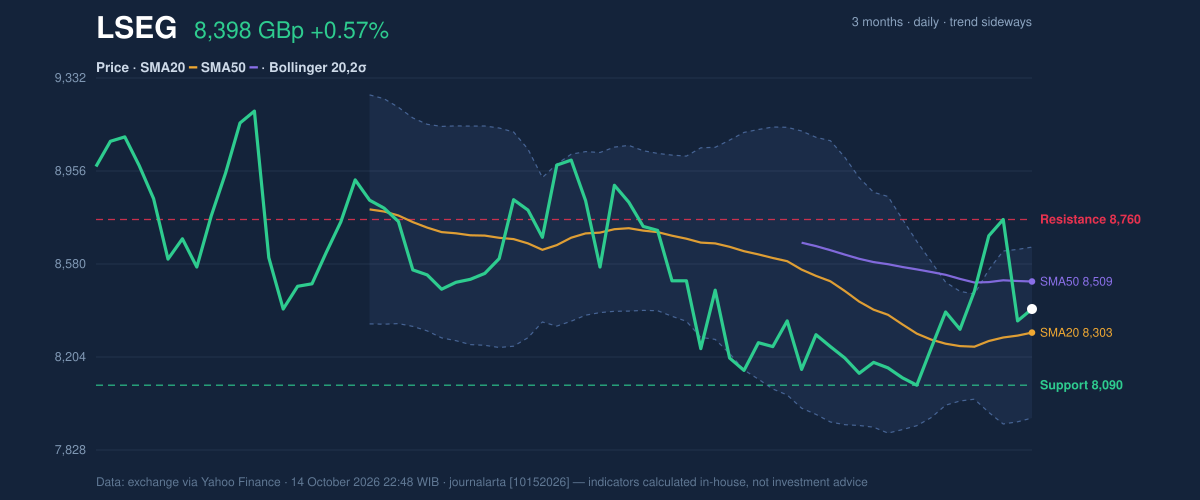
LSEG shares rose 0.57% to 8,398.00 GBp on 14 October, extending gains to 0.99% over five trading days and 3.04% over one month. The move leaves the London Stock Exchange Group stock above its 20-day average but below its 50-day average, a mixed setup that points to short-term resilience without a confirmed broader trend reversal.
Trend & Price Action
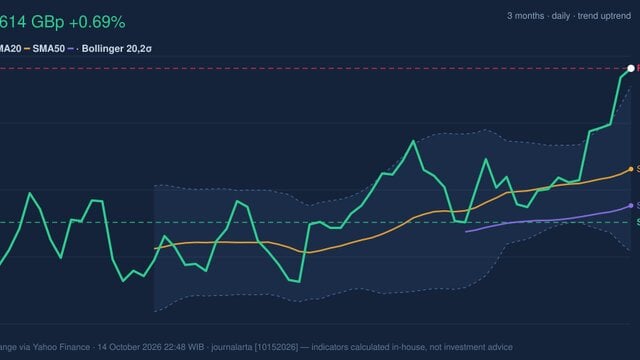
The share price is 95.20 GBp above the SMA20, at 8,302.80, while still 111.20 GBp below the SMA50, at 8,509.20. The 20-day average has a modest upward slope of 0.67% over five days, but there has been no recent moving-average crossover. In plain terms, buyers have improved the near-term structure, yet the longer average remains a hurdle rather than evidence of a sustained uptrend.
The stock is described as sideways and sits at 46% of its stated 20-day range, between support at 8,090.00 GBp and resistance at 8,760.00 GBp. That position is closer to the middle than to either boundary, so the latest gain alone does not establish a breakout. The three-month high is 9,890.00 GBp; the reported low is 0.00, which offers little practical context for gauging the current trading range.
The Bollinger middle band coincides with the SMA20 at 8,302.80. The price is above that midpoint, while %B at 64% places it between the middle and upper bands. The band width is 8.3%, classified as normal rather than unusually compressed or expanded, so the chart does not signal a pronounced volatility squeeze.
3-month price action chart of LSEG: price, SMA20/50, Bollinger, support & resistance. Data: exchange via Yahoo Finance.
Oscillators & Momentum
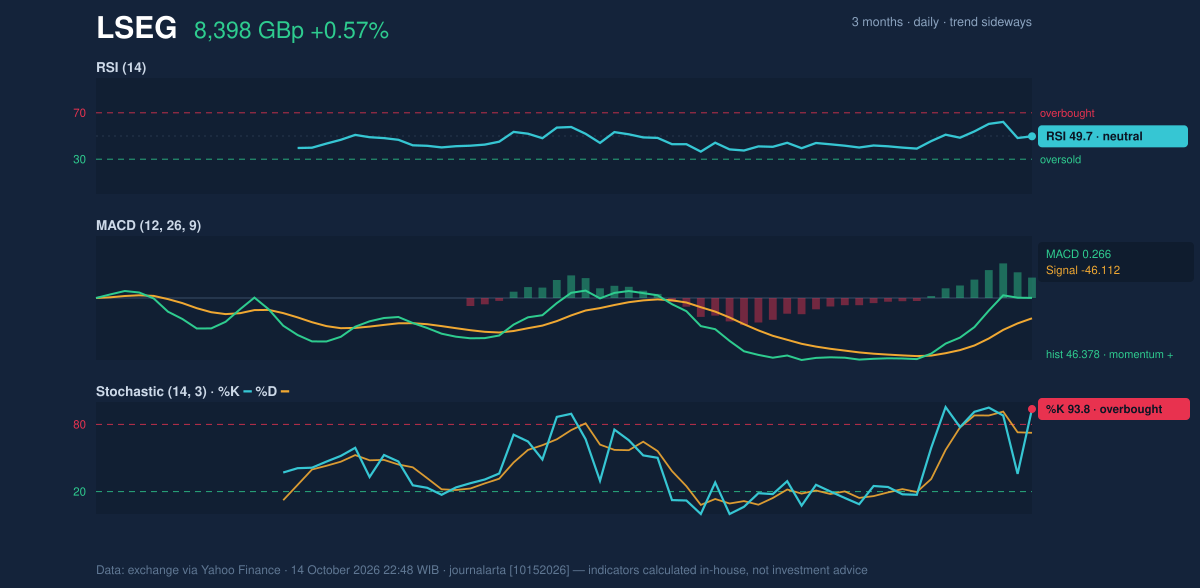
Momentum readings are split. RSI at 49.7 is neutral, consistent with a market that has not established strong directional control. By contrast, Stochastic %K at 93.8 and %D at 72.5 is overbought: the faster line is high relative to its recent range, which can reflect strong short-term buying but also leaves less room before a pullback or pause.
MACD is more constructive. The histogram is positive at 46.378, with MACD at 0.266 against a signal reading of -46.112. That configuration indicates improving momentum in the indicator’s calculation, but it does not erase the gap below the SMA50 or the sideways trend classification. The distinction matters: momentum can strengthen before price confirms a lasting change in trend.
Momentum chart of LSEG: RSI(14), MACD, Stochastic. Data: exchange via Yahoo Finance.
Volatility & Trading Activity
The ATR is 809.67 GBp, equal to 9.6% of the share price, signalling high volatility. ATR estimates the typical scale of price movement; it does not indicate direction. Against that backdrop, the day’s 0.57% rise is a modest move, not by itself a decisive change in risk or trend.
Participation is the clearest caution in the data. Reported volume was 40 against a 20-day average of 1,332,165, classified as thin volume, while OBV was falling. OBV tracks whether volume tends to accompany rising or falling prices; a declining reading can suggest that buying pressure is not being confirmed. The sharp gap between the reported session volume and its average also means the latest price move should be treated cautiously rather than as strong evidence of broad participation.
Technical Verdict: HOLD
HOLD (wait & see) fits the mixed evidence: the price is above a gently rising SMA20 and MACD momentum is positive, but it remains below the SMA50, the Stochastic is overbought, and falling OBV with thin volume weakens confirmation.
- Ideal entry range: 8,090.00–8,302.80 GBp, around 20-day support and the SMA20, if the price holds that area.
- Exit target (target price): 8,648.15–8,760.00 GBp, spanning the upper Bollinger band and 20-day resistance.
- Stop-loss protection: 7,957.45 GBp, at the lower Bollinger band.
- Invalidation: The verdict is invalidated if the price falls below 8,090.00 GBp, the stated 20-day support.
The chart points to a stock with improving short-term momentum, but not yet enough trend and volume confirmation to resolve its sideways pattern.
Summary Data LSEG
Last price
8,398.00 GBp
Change 1 day / 5 days / 1 month
0.57% / 0.99% / 3.04%
Trend / MA-cross
sideways / none
SMA20 / SMA50
8,302.80 / 8,509.20
RSI (14) / Stochastic %K
49.7 / 93.8
Bollinger %B / ATR
64% / 809.67
Support / Resistance 20 days
8,090.00 / 8,760.00
Data as of
14 October 2026 22:48 WIB
Disclaimer: This technical analysis is generated automatically from exchange data (via Yahoo Finance) and indicators calculated by JournalArta, for information and education only. The verdict and the entry, target and stop-loss levels are not investment advice or a solicitation to buy or sell any security. Investment decisions and their risks rest solely with the reader.