GSK Stock Gains 2.89% on Thursday, Momentum Gains
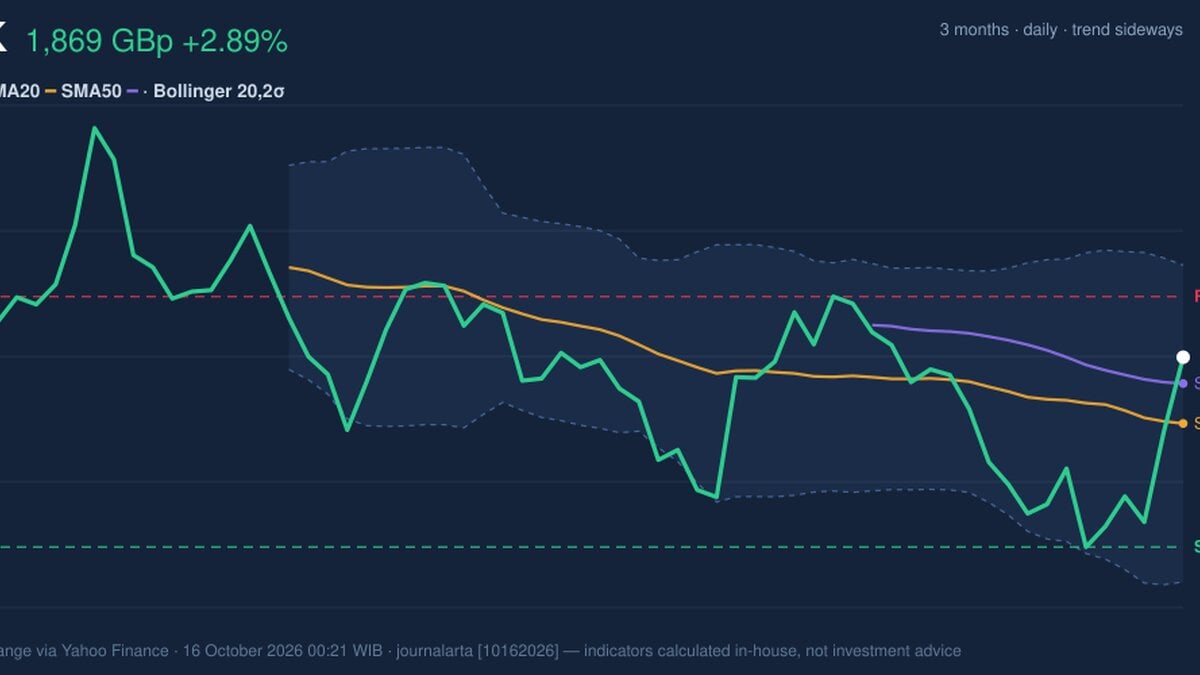
On October 15, 2026: price 1,868.50 GBp, trend sideways, RSI 57.1, support 1,735.50, resistance 1,911.00. technical analysis of gsk stock.
Why GSK is in focus today
- MACD histogram has just turned positive
Selected automatically from 16 LSE (UK) stocks by a technical-signal score with daily weighted randomisation — not a recommendation.
Trend & Price Action
The share price has climbed 7.66% over five days, recovering from a 1.66% decline over the month. It now stands above the SMA20 at 1,822.00 and the SMA50 at 1,850.05, a constructive position in the short term. But there has been no new moving-average crossover, and the 20-day average is sloping down by 0.78% over five days. That combination points to a rebound within a sideways structure, not yet a confirmed change in trend. The shares sit at 76% of their 20-day range, between support at 1,735.50 and resistance at 1,911.00. The position near the upper end of that range leaves less room before a test of resistance. The three-month high is 2,096.00; the supplied low is 0.00, which is not a useful reference for assessing a tradable floor. As shown in the chart, the price is above the Bollinger midline at 1,822.00 and below the upper band at 1,933.03. Its Bollinger %B reading of 71% places it in the upper portion of the band, consistent with recent strength but not, by itself, proof of a breakout.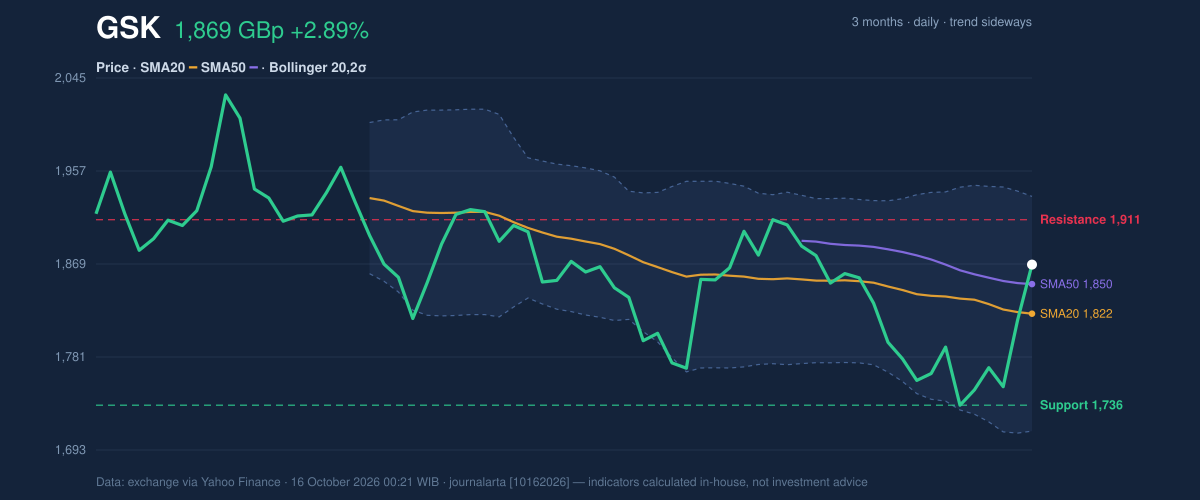
Oscillators & Momentum
Momentum indicators are improving, though they do not all point in the same direction. The MACD histogram is positive at 5.228, with MACD at -17.494 above its signal line at -22.722. This indicates that downward momentum has eased and the short-term balance has shifted in a more positive direction; both MACD lines nevertheless remain below zero, so the longer momentum backdrop is not decisively strong. The RSI is neutral at 57.1, offering room for movement without signalling an extreme. By contrast, the Stochastic %K at 97.5 is overbought, while %D is 50.5. That sharp gap suggests the latest rise may have moved faster than the broader trend can comfortably sustain. It is a warning of possible near-term cooling, not a standalone signal that the price must reverse.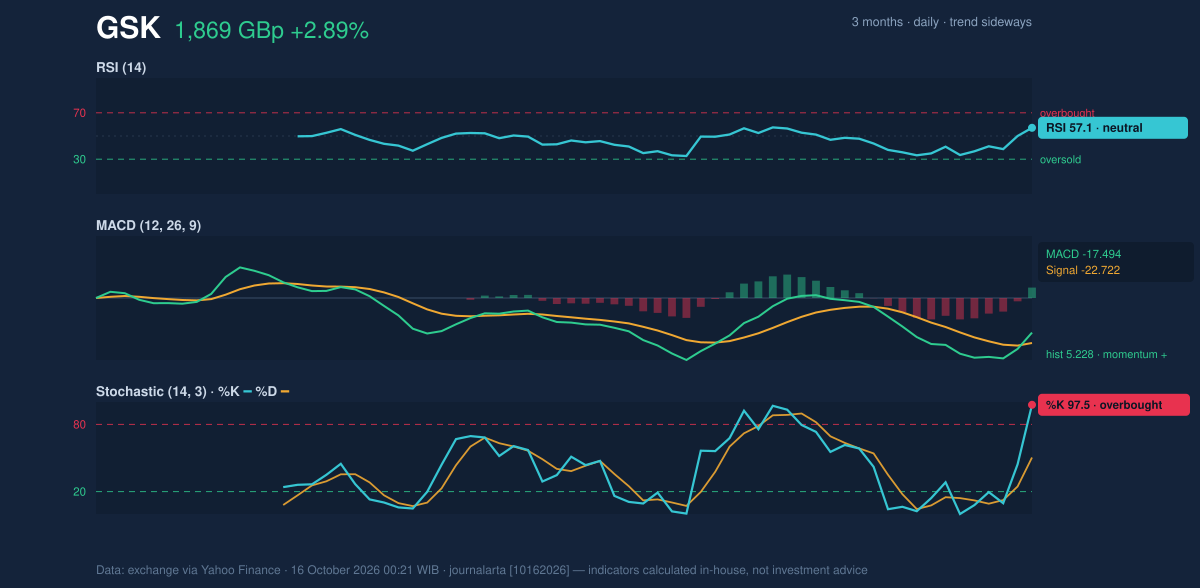
Volatility & Volume
The Bollinger bands have a normal width of 12.2%, so the data do not show a volatility squeeze that might precede an unusually forceful move. But day-to-day risk remains substantial: ATR is 175.49, or 9.4% of the share price. ATR estimates the typical range of price movement; here, it cautions that even a technically orderly trade can involve wide swings. Participation is the clearest weakness in the latest advance. Volume was 520,000 shares, only 0.1 times the 20-day average of 6,834,918, while OBV is falling. On-balance volume tracks whether trading is more heavily associated with rising or falling sessions. Its decline, alongside thin turnover, means the price gain lacks strong evidence of broad buying pressure.Key Levels & Scenarios
A move through 1,911.00 resistance would strengthen the case that the rebound is extending beyond its recent range, particularly if trading activity also improves. Failure to clear that level could leave the shares consolidating below resistance, with the upper Bollinger band at 1,933.03 another nearby reference. On a pullback, the SMA50 at 1,850.05 and SMA20 at 1,822.00 are intermediate markers; the more important stated range floor is 1,735.50 support. A break below that level would undermine the current recovery structure. These levels are guides to the chart, not guarantees: ATR indicates that price can move sharply around them.Technical Verdict: HOLD
HOLD (wait & see) is the clearest technical reading: MACD momentum has turned positive and price is above both moving averages, but overbought Stochastic readings, falling OBV and exceptionally light volume make the advance difficult to confirm. The verdict is invalidated if price falls below 1,735.50 support. - Ideal Entry Range: 1,822.00–1,850.05, around the SMA20 and SMA50. - Exit Target: 1,911.00, the stated 20-day resistance. - Stop Loss protection: 1,710.97, the lower Bollinger band. In plain English, the chart is improving, but stronger trading participation or a clearer hold above resistance is needed to confirm the move. | Indicator | Reading | |---|---:| | Last price | 1,868.50 GBp | | SMA20 / SMA50 | 1,822.00 / 1,850.05 | | RSI / Stochastic %K | 57.1 / 97.5 | | MACD histogram | 5.228 | | Support / Resistance | 1,735.50 / 1,911.00 | | Volume vs. 20-day average | 0.1× |Summary Data GSK
| Last price | 1,868.50 GBp |
| Change 1 day / 5 days / 1 month | 2.89% / 7.66% / -1.66% |
| Trend / MA-cross | sideways / none |
| SMA20 / SMA50 | 1,822.00 / 1,850.05 |
| RSI (14) / Stochastic %K | 57.1 / 97.5 |
| Bollinger %B / ATR | 71% / 175.49 |
| Support / Resistance 20 days | 1,735.50 / 1,911.00 |
| Data as of | 16 October 2026 00:21 WIB |
Disclaimer: This technical analysis is generated automatically from exchange data (via Yahoo Finance) and indicators calculated by JournalArta, for information and education only. The verdict and the entry, target and stop-loss levels are not investment advice or a solicitation to buy or sell any security. Investment decisions and their risks rest solely with the reader.
Track GSK share price daily: live levels, support/resistance and our full GSK analysis history.