RELX RSI Overbought: Stock Gains 4.00% (October 15, 2026)
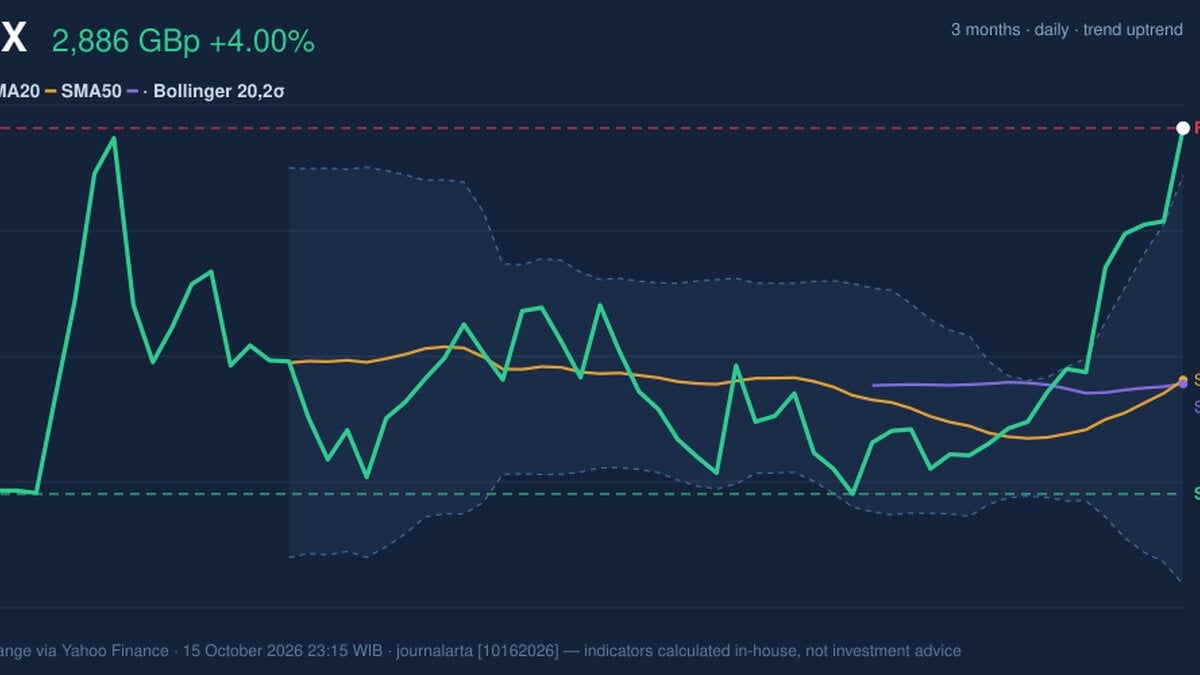
On October 15, 2026: price 2,886.00 GBp, trend uptrend, RSI 77.0, support 2,450.00, resistance 2,886.00. technical analysis of relx stock.
Why RELX is in focus today
- Closed at a 20-day high (2,886.00)
- Trading near its 3-month high (2,886.00)
- Fresh golden cross: SMA20 crossed above SMA50
- RSI(14) at 77.0 — overbought zone
- Uptrend confirmed (5-day change 11.21%)
Selected automatically from 16 LSE (UK) stocks by a technical-signal score with daily weighted randomisation — not a recommendation.
Trend & Price Action
RELX’s close at 2,886.00 is above the upper Bollinger Band, which stands at 2,829.80. Bollinger Bands plot a moving average and boundaries based on price variation; a close beyond the upper band can reflect strong buying pressure, but it can also mean the price has advanced faster than its recent norm. The %B reading of 112% confirms the close is outside that upper boundary. The band width is 18.9%, classified as normal, so the data do not point to an unusually compressed setup immediately before the rise. The price is at the top of its reported 20-day range, with resistance at 2,886.00 and support at 2,450.00. A break above resistance would extend the current range; failure to hold gains could bring the support level into focus. The supplied three-month high is also 2,886.00, while the reported low is 0.00, making that low unsuitable as a meaningful comparison for price structure.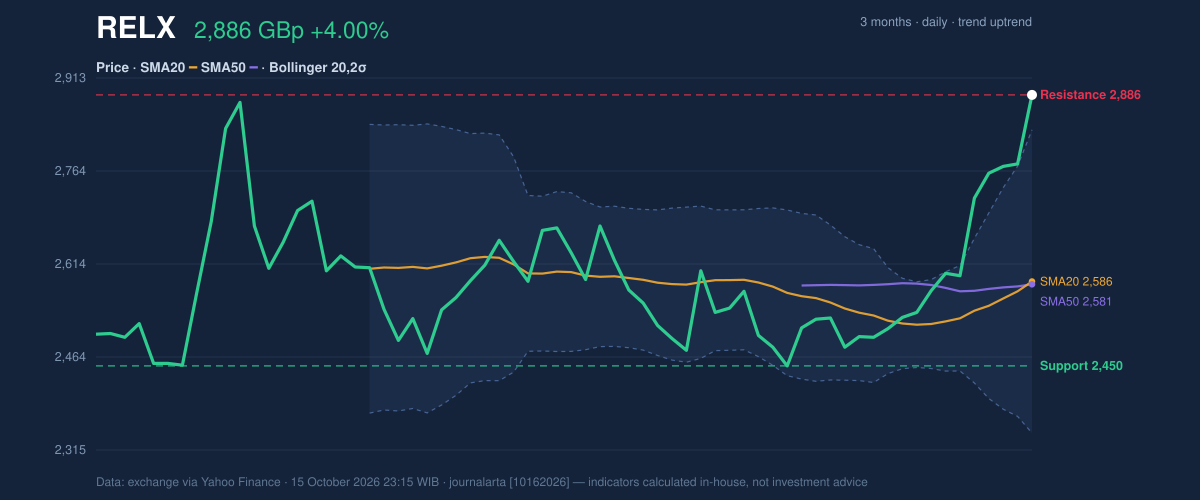
Oscillators & Momentum
Momentum indicators confirm the recent acceleration, but also warn that the advance is crowded. The RSI is 77.0, in overbought territory. The Relative Strength Index measures the speed of recent price moves; a high reading indicates forceful buying, not an automatic reversal. The Stochastic readings are also overbought, with %K at 100.0 and %D at 97.1. Together, these readings suggest that the rally may be vulnerable to pauses or sharp swings even while the broader trend remains upward. The MACD is positive: its value of 64.219 is above the 26.167 signal line, and the 38.052 histogram is positive. MACD compares faster and slower moving averages to show whether momentum is strengthening or weakening. Its current configuration supports the trend signal from the golden cross, rather than contradicting it.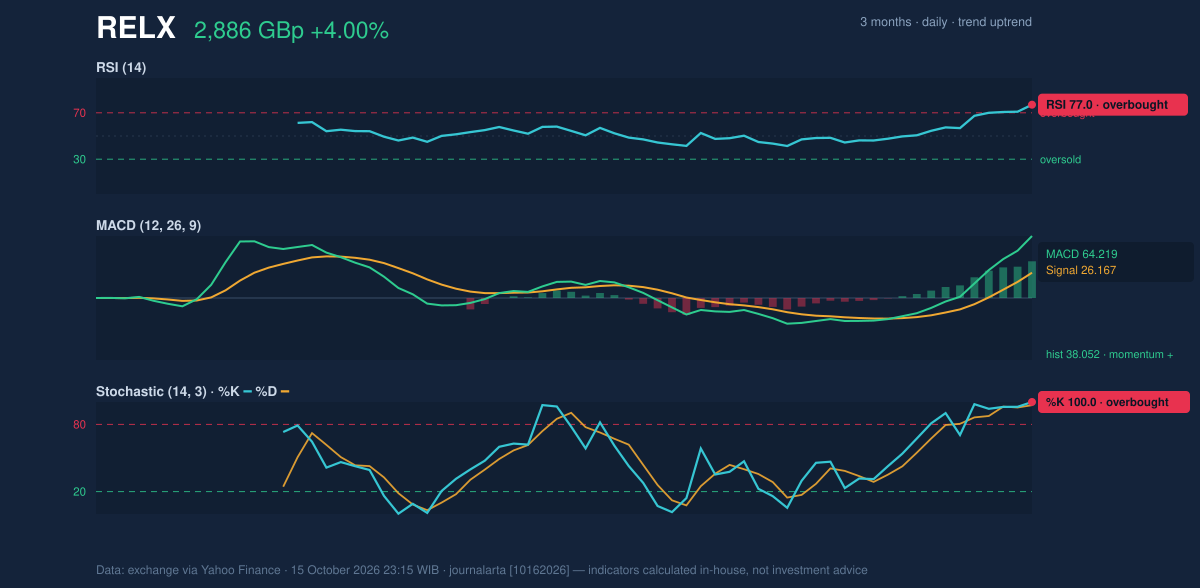
Volatility & Volume
The advance has not yet been matched by heavy participation. RELX traded 1,593,000 shares, about 0.4 times its 20-day average of 3,744,850, which the data classifies as thin volume. On-Balance Volume (OBV), a measure that accumulates volume on rising days and subtracts it on falling days, is rising. That is a supportive sign, although the latest session’s low volume makes the price breakout less strongly confirmed by trading activity. The average true range (ATR), a measure of typical price movement, is 274.72 GBp, or 9.5% of the share price. That indicates high volatility: a move of this scale can make short-term swings larger and increases the risk of treating a single session as a settled trend change.Technical Verdict: HOLD
HOLD (wait & see) reflects a split signal: the golden cross, rising MACD and positive OBV support the uptrend, while overbought RSI and Stochastic readings, a close above the upper Bollinger Band and thin volume argue for caution. The verdict is invalidated if the price falls below 2,450.00 GBp, the stated 20-day support. - Indicative entry range: 2,585.80–2,829.80 GBp, bounded by the SMA20 and upper Bollinger Band. - Indicative exit target: 2,886.00 GBp, the stated 20-day resistance. - Stop-loss protection level: 2,450.00 GBp, the stated support. In plain English, the trend is strong, but the rally looks extended and needs firmer participation to confirm it.| Metric | Reading |
|---|---|
| Last price | 2,886.00 GBp |
| Change | 4.00% in one day; 11.21% in five days |
| SMA20 / SMA50 | 2,585.80 / 2,581.22 GBp; golden cross |
| RSI / Stochastic | 77.0; %K 100.0 / %D 97.1 |
| MACD / signal | 64.219 / 26.167 |
| Support / resistance | 2,450.00 / 2,886.00 GBp |
| Volume / 20-day average | 1,593,000 / 3,744,850 |
Summary Data RELX
| Last price | 2,886.00 GBp |
| Change 1 day / 5 days / 1 month | 4.00% / 11.21% / 12.30% |
| Trend / MA-cross | uptrend / golden |
| SMA20 / SMA50 | 2,585.80 / 2,581.22 |
| RSI (14) / Stochastic %K | 77.0 / 100.0 |
| Bollinger %B / ATR | 112% / 274.72 |
| Support / Resistance 20 days | 2,450.00 / 2,886.00 |
| Data as of | 15 October 2026 23:15 WIB |
Disclaimer: This technical analysis is generated automatically from exchange data (via Yahoo Finance) and indicators calculated by JournalArta, for information and education only. The verdict and the entry, target and stop-loss levels are not investment advice or a solicitation to buy or sell any security. Investment decisions and their risks rest solely with the reader.
Track RELX share price daily: live levels, support/resistance and our full RELX analysis history.