Rio Tinto Stock Drops 2.12%, Testing Support Level In Focus
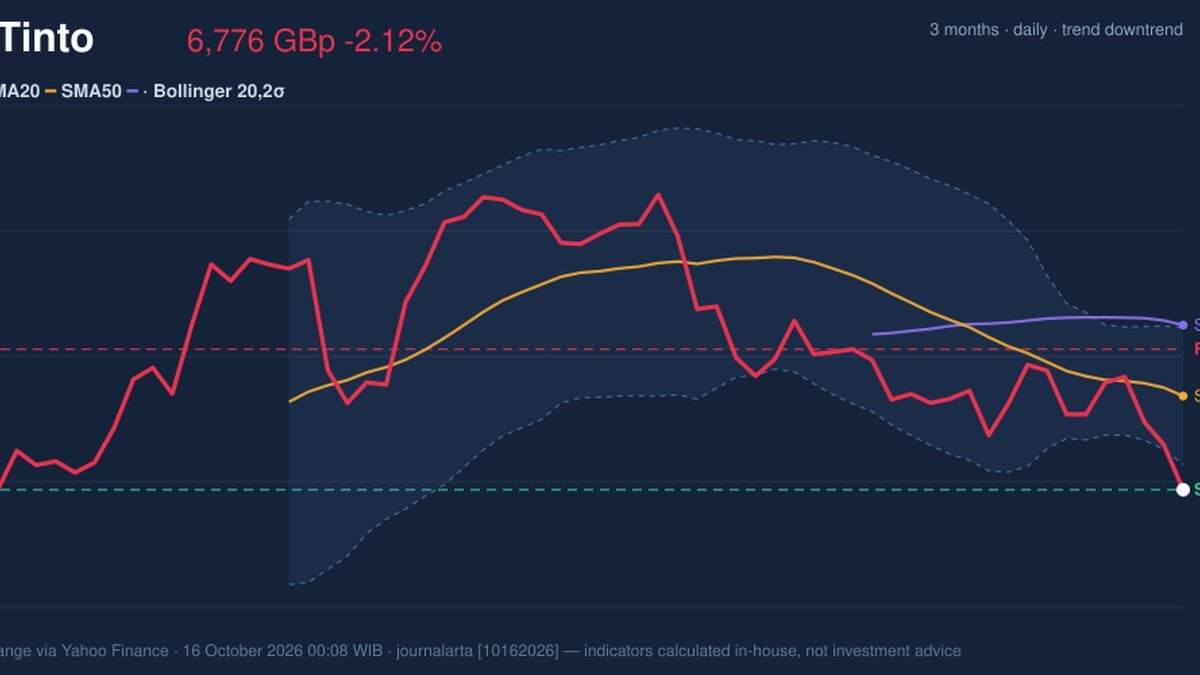
On October 15, 2026: price 6,776.00 GBp, trend downtrend, RSI 33.0, support 6,776.00, resistance 7,234.00. technical analysis of rio tinto stock.
Why Rio Tinto is in focus today
- Closed at a 20-day low (6,776.00)
- Breaking out of a Bollinger squeeze (band width 6.3%)
- Downtrend extending (5-day change -3.50%)
Selected automatically from 16 LSE (UK) stocks by a technical-signal score with daily weighted randomisation — not a recommendation.
Trend & Price Action
The close was below both the 20-day simple moving average (SMA) of 7,081.55 and the 50-day SMA of 7,313.04. The 20-day average is falling, down 0.90% over five trading days, and no new moving-average crossover has formed. In plain terms, the short-term trend is weakening, but there is no fresh crossover signal to suggest a decisive change in the longer trend. The 1-month loss of 7.52% reinforces that picture. The share price is also at the bottom of its 20-day range, with support at 6,776.00 and resistance at 7,234.00. A close at support makes that level the immediate test: holding it could steady the price, while a break below would leave the existing chart data without a lower support level to reference. The price is below both moving averages, and the 20-day trend is still falling. As shown in the chart, the share price sits below the lower Bollinger Band, while the moving averages remain overhead.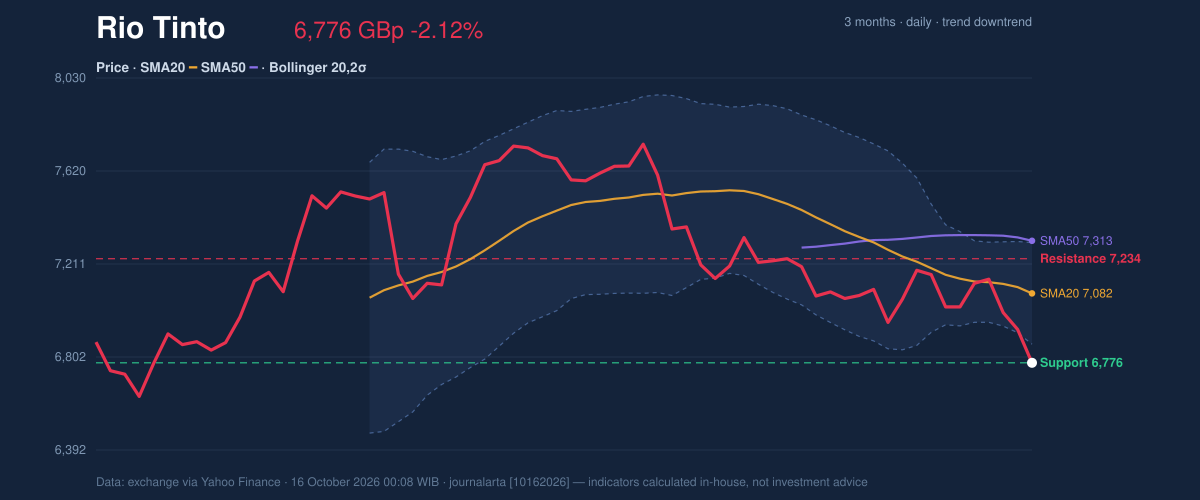
Oscillators & Momentum
Momentum indicators offer a mixed signal, but the balance remains weak. The RSI is 33.0, a neutral reading that is near, but not in, the commonly watched oversold territory. It suggests selling has been persistent without yet showing a clear exhaustion signal. The Stochastic %K at 93.1 versus %D at 48.6 is overbought, a sharp short-term reading that can occur during a rebound or a brief swing within a broader decline. It is not, on its own, confirmation that the downtrend has reversed. The MACD is negative at -98.535, below its -80.618 signal line, with a -17.917 histogram; that configuration points to negative momentum rather than an established recovery. The indicators are not saying the same thing. The Stochastic reading flags near-term heat, while the MACD and falling moving average point to continued underlying weakness. As shown in the momentum chart, the gap between the MACD and its signal line remains negative.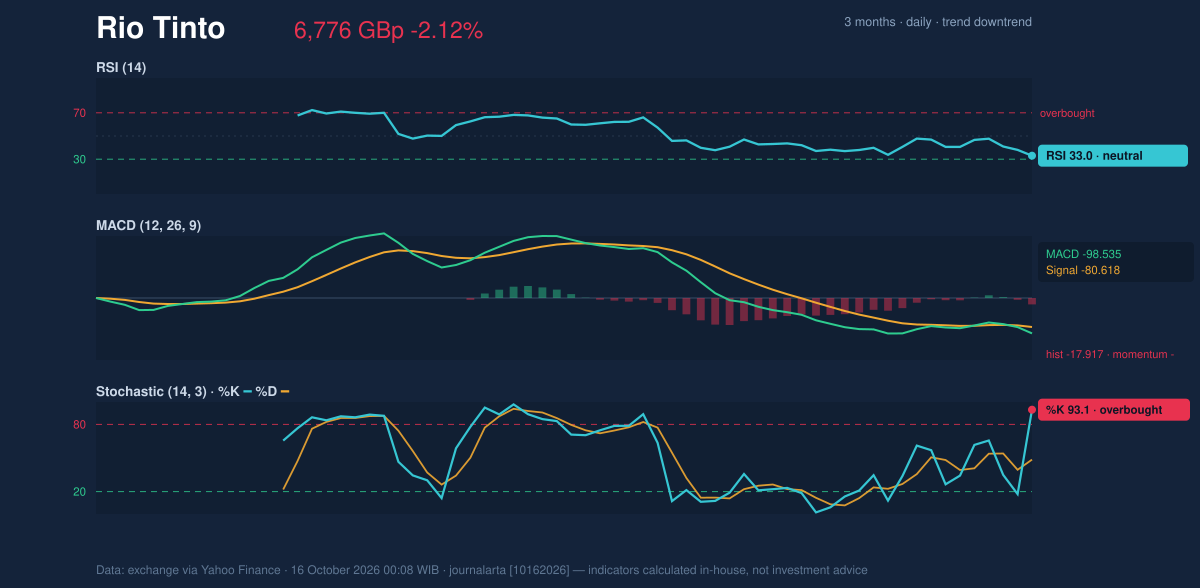
Volatility & Volume
The Bollinger Band width is 6.3%, indicating a squeeze, or a period when price volatility has narrowed. Squeezes can precede a larger move, but they do not predict its direction. Here, the price has moved below the lower band, with %B at -18%, showing it is outside the band’s usual range; that makes the downside break more notable, while also warning against treating the move as a standalone forecast. The ATR is 650.27, equal to 9.6% of the share price, signalling high volatility. ATR estimates the typical range of price movement, not its direction, and means levels can be tested sharply. Participation offers little confirmation of the latest decline: volume was 51,000 against a 20-day average of 2,046,359, while OBV was falling. The session’s volume was thin, so the price move came without typical trading activity.Key Levels & Scenarios
Support is 6,776.00 GBp, the current close and the 20-day low. If the price holds there, the first level to watch above is resistance at 7,234.00 GBp. A move through that resistance would still face the 20-day average at 7,081.55 on the way up, while the 50-day average at 7,313.04 marks a higher technical hurdle. If support fails, the supplied data provides no further downside level.Technical Verdict: SELL
The technical verdict is SELL, reflecting the downtrend rather than a forecast of future performance. The strongest signals are the price below the falling SMA20 and below the SMA50; negative MACD momentum; and a close at 20-day support after a five-day decline. The low RSI and thin volume temper confidence in the move, while high ATR raises the risk of abrupt swings. The verdict is invalidated if the price breaks below 6,776.00 GBp, the defined support and current 20-day low; that would require reassessing the chart because the data gives no lower reference level. - Ideal entry range: 6,776.00–7,081.55 GBp, bounded by support and the SMA20. - Exit target: 7,234.00 GBp, the stated 20-day resistance. - Stop-loss protection: below 6,776.00 GBp, the stated support level. For non-traders, the chart remains weak, though thin trading and volatile swings make the near-term signal less certain. Market data: London Stock Exchange via Yahoo Finance, as of 16 October 2026, 00:08 WIB. Technical analysis is not an investment recommendation.Summary Data Rio Tinto
| Last price | 6,776.00 GBp |
| Change 1 day / 5 days / 1 month | -2.12% / -3.50% / -7.52% |
| Trend / MA-cross | downtrend / none |
| SMA20 / SMA50 | 7,081.55 / 7,313.04 |
| RSI (14) / Stochastic %K | 33.0 / 93.1 |
| Bollinger %B / ATR | -18% / 650.27 |
| Support / Resistance 20 days | 6,776.00 / 7,234.00 |
| Data as of | 16 October 2026 00:08 WIB |
Disclaimer: This technical analysis is generated automatically from exchange data (via Yahoo Finance) and indicators calculated by JournalArta, for information and education only. The verdict and the entry, target and stop-loss levels are not investment advice or a solicitation to buy or sell any security. Investment decisions and their risks rest solely with the reader.
Track Rio Tinto share price daily: live levels, support/resistance and our full Rio Tinto analysis history.