Glencore Stock Drops 2.95%, Testing Support Level In Focus
On October 22, 2026: price 536.50 GBp, trend sideways, RSI 36.7, support 536.50, resistance 586.30. technical analysis of glencore stock.
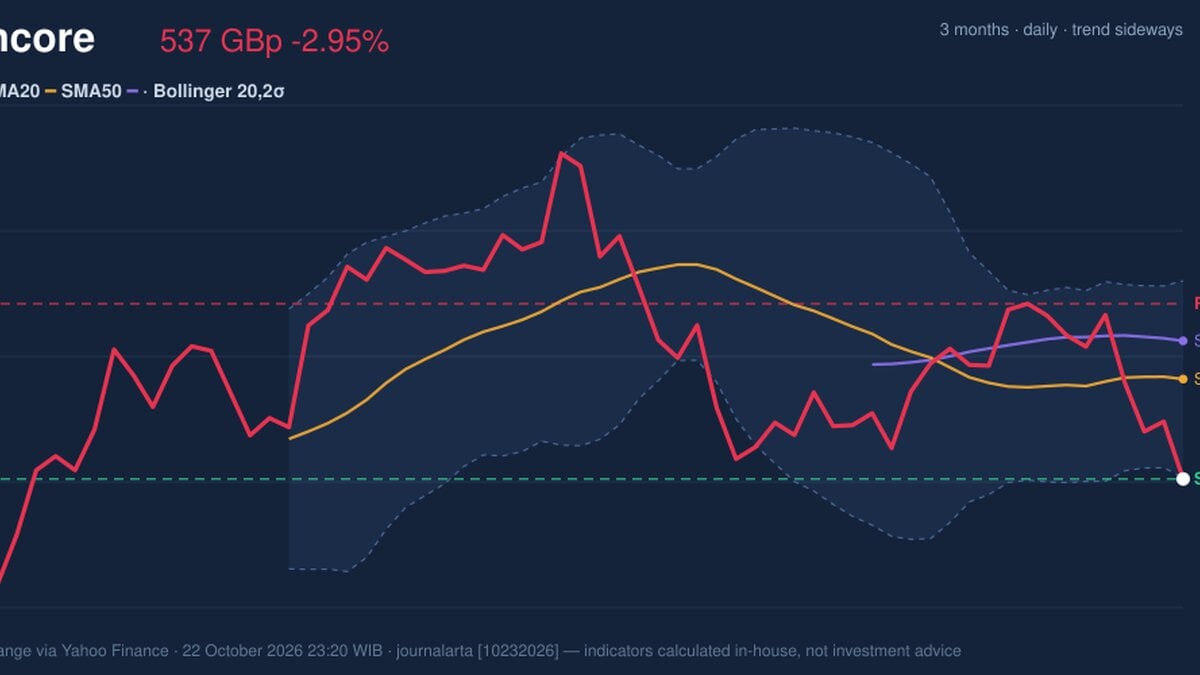
Why Glencore is in focus today
- Closed at a 20-day low (536.50)
- Not covered by JournalArta in the last 14 days
Selected automatically from 16 LSE (UK) stocks by a technical-signal score with daily weighted randomisation — not a recommendation.
Trend & Price Action
The latest decline extends a difficult stretch: Glencore fell 6.55% over five trading days and 2.28% over one month. Its broader trend is classed as sideways, but the price is below both the 20-day simple moving average (SMA20), at 564.90 GBp, and the 50-day average, at 575.75 GBp. A simple moving average tracks the average closing price over a set period; trading below both suggests the shares have not yet reclaimed their recent trend levels. There has been no new moving-average crossover, so the data do not show a fresh long-term trend signal. The SMA20 is edging higher, with a slope of 0.36% over five days, but that modest rise has not prevented the price from falling. The gap between the latest close and the averages therefore matters more than the slight upward tilt: near-term trading remains under pressure. The shares ended at the lower boundary of their 20-day range, with support at 536.50 GBp and resistance at 586.30 GBp. That makes the next move unusually consequential for the short-term chart: holding the floor would preserve the range, while a sustained break below it would mark a fresh deterioration. The three-month high is 669.30 GBp; the supplied low is 0.00, which is not a useful trading reference.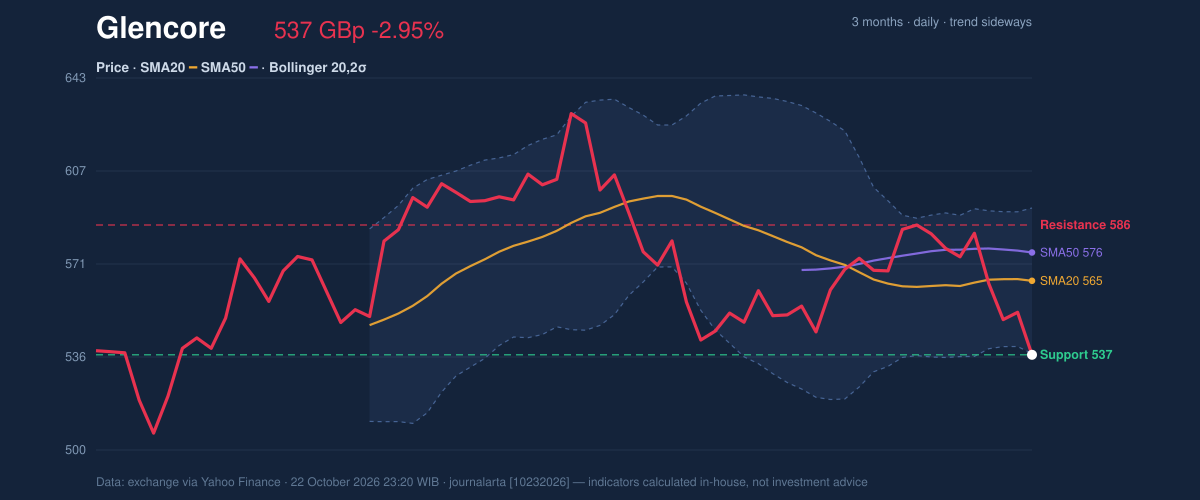
Oscillators & Momentum
Momentum indicators lean negative, though they are not all giving the same message. The 14-day Relative Strength Index (RSI), which gauges the pace of recent gains and losses, stands at 36.7 and is labelled neutral. It is below the midpoint of its scale, indicating weak momentum, but it does not by itself confirm an oversold condition. The Stochastic oscillator is more complicated: %K is 80.2 and %D is 31.2, with the reading flagged as overbought. This indicator compares a closing price with its recent range, so the elevated %K points to a strong position within that calculation even as the shares sit at their 20-day low. The divergence cautions against treating any one oscillator as a standalone reversal signal. The Moving Average Convergence Divergence (MACD), which compares faster and slower price averages to assess momentum, remains negative: MACD is -4.442, below its signal line at -1.458, with a negative histogram of -2.984. That configuration indicates downside momentum is still dominant. As shown in the chart, the indicators need to turn together before a stronger recovery signal emerges.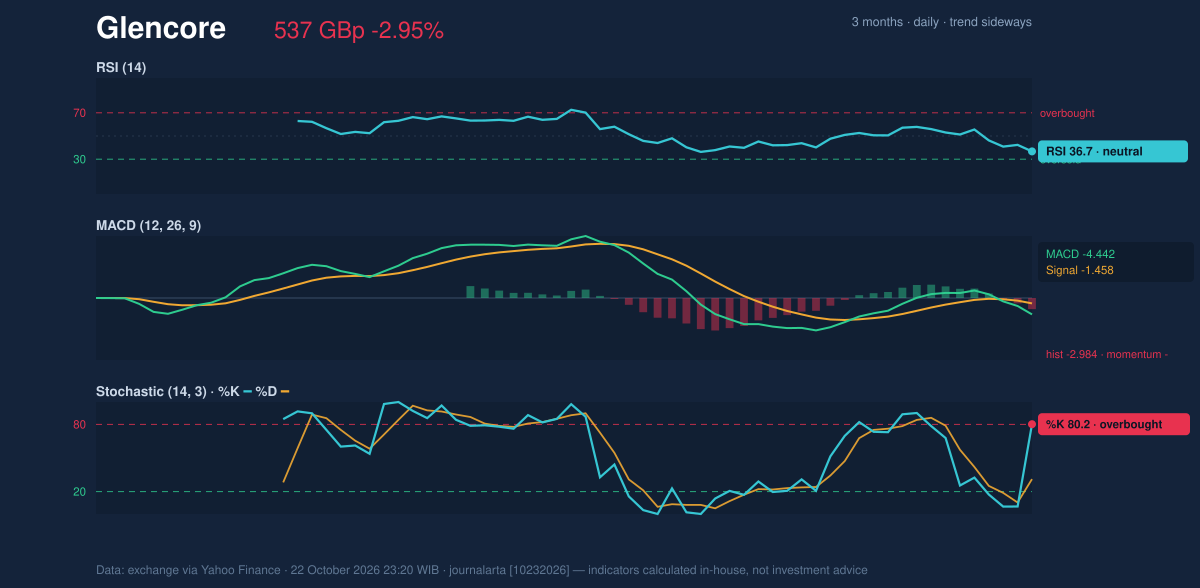
Volatility & Volume
Glencore is approaching the lower Bollinger Band, a volatility envelope around its moving average. The lower band is 536.99 GBp, just above the latest close, while the upper band is 592.82 GBp and the middle line is 564.90 GBp. The %B reading of -1% places the price fractionally outside the band, a sign of pronounced short-term weakness rather than proof that a rebound is due. The band width is 9.9%, described as normal, so the setup is not a clear volatility squeeze. The Average True Range (ATR), a measure of typical price movement, is 62.02 GBp, or 11.6% of the share price. That points to high volatility and means moves around technical levels may be substantial. Volume was reported at 24,984 against a 20-day average of 27,716,352, classified as thin, while On-Balance Volume (OBV)—a running measure that combines price direction with trading volume—was falling. The volume reading offers little confirmation of the latest move, but the declining OBV is consistent with weakening participation.Key Levels & Scenarios
The immediate test is 536.50 GBp, the stated 20-day support and the closing price. A hold could keep the shares within their recent range, but a break below that level would invalidate a stabilisation case under this dataset. On a recovery, the first broader reference is the SMA20 at 564.90 GBp, followed by 586.30 GBp resistance. Reclaiming those levels would ease the immediate technical pressure, though the negative MACD would still need to improve.Technical Verdict: HOLD
The indicators support a wait-and-see stance rather than a directional call. The reasons are the close at 20-day support while below both moving averages, negative MACD momentum, and a falling OBV; the RSI is weak but still labelled neutral, leaving no clear oversold confirmation. The verdict is invalidated if the price breaks below 536.50 GBp.- Ideal entry range: 536.50–564.90 GBp, bounded by 20-day support and the SMA20; this is a technical reference range, not a recommendation.
- Exit target: 586.30 GBp, the stated 20-day resistance.
- Stop-loss protection: below 536.50 GBp, the support level underpinning this range-based setup.
Summary Data Glencore
| Last price | 536.50 GBp |
| Change 1 day / 5 days / 1 month | -2.95% / -6.55% / -2.28% |
| Trend / MA-cross | sideways / none |
| SMA20 / SMA50 | 564.90 / 575.75 |
| RSI (14) / Stochastic %K | 36.7 / 80.2 |
| Bollinger %B / ATR | -1% / 62.02 |
| Support / Resistance 20 days | 536.50 / 586.30 |
| Data as of | 22 October 2026 23:20 WIB |
Disclaimer: This technical analysis is generated automatically from exchange data (via Yahoo Finance) and indicators calculated by JournalArta, for information and education only. The verdict and the entry, target and stop-loss levels are not investment advice or a solicitation to buy or sell any security. Investment decisions and their risks rest solely with the reader.
Track Glencore share price daily: live levels, support/resistance and our full Glencore analysis history.