GSK Testing Key Resistance: Stock Gains 2.46% (October 22, 2026)
On October 22, 2026: price 1,914.00 GBp, trend sideways, RSI 62.8, support 1,735.50, resistance 1,914.00. technical analysis of gsk stock.
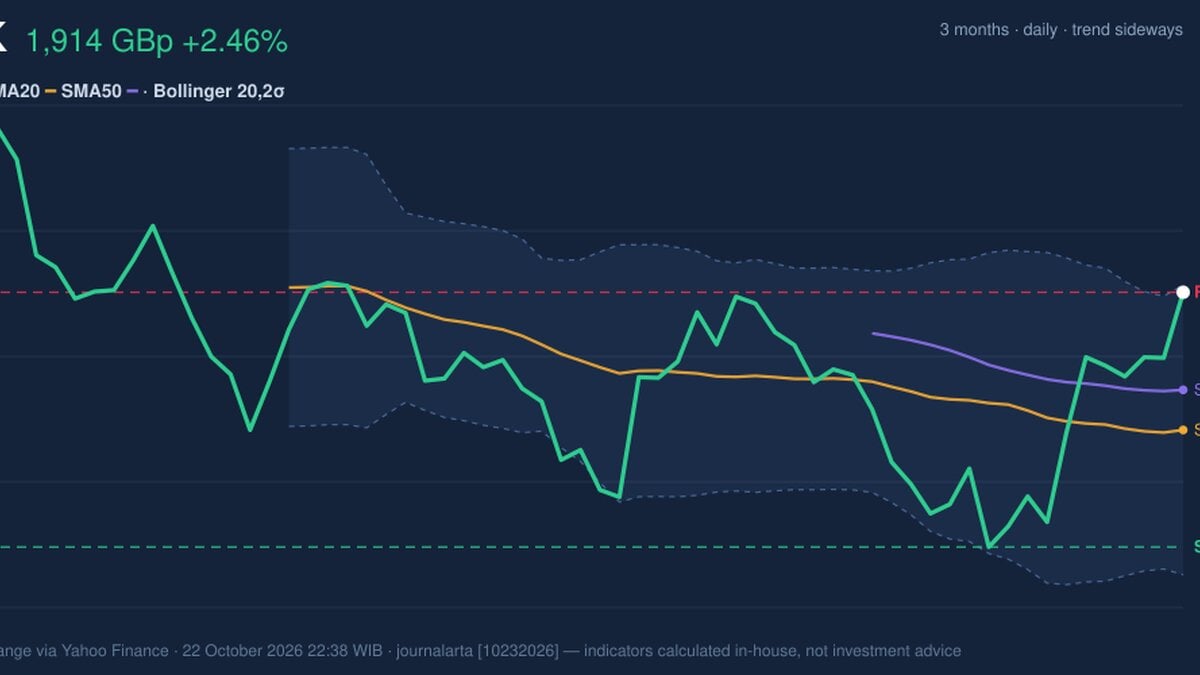
Why GSK is in focus today
- Closed at a 20-day high (1,914.00)
Selected automatically from 16 LSE (UK) stocks by a technical-signal score with daily weighted randomisation — not a recommendation.
Trend & Price Action
GSK is trading above its SMA20 at 1,817.53 GBp and SMA50 at 1,845.62 GBp, a constructive position because buyers have lifted the price above both commonly watched trend measures. But the averages themselves do not yet signal a fresh change in direction, and the SMA20’s slope is down 0.25% over five days. That combination points to improving near-term price action inside an otherwise hesitant structure. The share is at 100% of its 20-day range, with 1,914.00 GBp marking both the latest close and the stated 20-day resistance. A close at the range ceiling shows buyers have made progress; it also means the next test is whether demand can carry the price beyond that barrier. The three-month high is 2,158.00 GBp, while the reported low is 0.00 GBp; that low provides little practical context for assessing nearby support. As shown in the chart, the price is pressing the upper band while remaining above its moving averages, but the range ceiling is the immediate hurdle.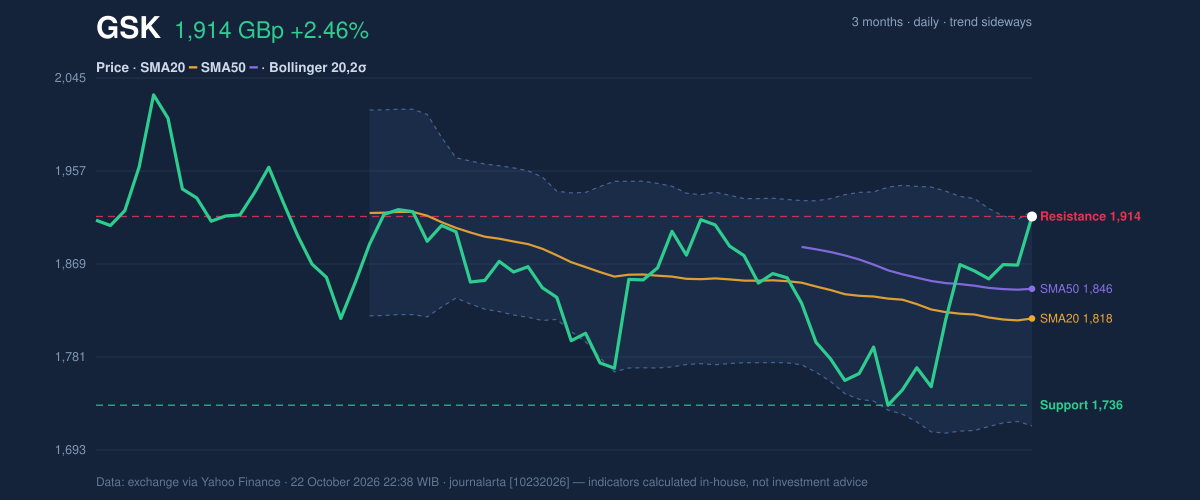
Oscillators & Momentum
Momentum indicators are positive, though they do not all tell the same story. The RSI is 62.8, a neutral reading, below the commonly used overbought threshold. The RSI, or Relative Strength Index, gauges the pace of recent gains and losses; its current level suggests strength without, by itself, indicating an extreme condition. The Stochastic %K is 88.7 versus %D at 50.5, an overbought signal. This indicator compares a closing price with its recent trading range, so a high reading near the top of the range can reflect strong buying pressure—but also a market vulnerable to a pause. The MACD histogram is positive at 15.296, with MACD at 7.654 against a signal reading of -7.642, reinforcing the case that upward momentum is building. MACD compares shorter- and longer-term price averages to track changes in momentum. As shown in the momentum chart, positive MACD and a neutral RSI sit alongside an overbought Stochastic reading: a mixed but broadly firm picture, rather than a clean confirmation from every measure.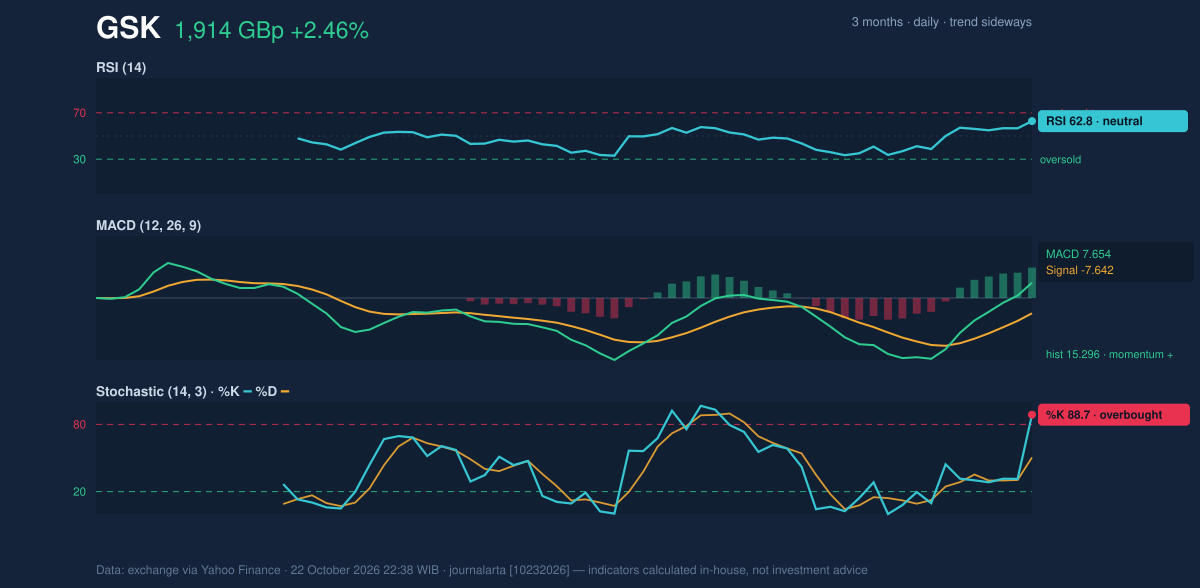
Volatility & Volume
The price is close to the upper Bollinger Band at 1,919.04 GBp, with the band’s %B reading at 98%. Bollinger Bands widen or contract around a moving average to show how far the price has moved relative to its recent range. A reading near the upper band confirms that GSK is testing the top of that range; it does not, on its own, establish a breakout. The band width is 11.2%, described as normal, so there is no signal here of an unusually compressed setup poised for a sharp expansion. Volatility remains high: ATR is 194.85, or 10.2% of the share price. ATR measures the typical size of price swings, not their direction, and cautions that moves around technical levels may be substantial. The latest reported volume of 1,760 is thin against a 20-day average of 7,260,910, although OBV is rising. OBV tracks whether volume broadly accompanies upward or downward price moves; its rise is supportive, but the exceptionally light latest trading makes the session’s participation difficult to assess.Key Levels & Scenarios
The immediate ceiling is resistance at 1,914.00 GBp; the nearest stated support is 1,735.50 GBp, with the SMA20 at 1,817.53 GBp offering an intermediate reference. A sustained move above resistance would strengthen the breakout case, particularly if trading volume also improves. If the price fails to hold above the moving averages, attention shifts toward the support zone; a break below 1,735.50 GBp would weaken the current constructive momentum picture.Technical Verdict: HOLD
HOLD (wait & see) is the clearest technical reading: GSK is above both moving averages and MACD momentum is positive, but it is also at the top of its 20-day range, with an overbought Stochastic and thin latest volume. The verdict is invalidated if the price falls below 1,735.50 GBp. - Ideal Entry Range: 1,817.53–1,845.62 GBp, based on SMA20 and SMA50. - Exit Target (Target Price): 1,919.04 GBp, the upper Bollinger Band and nearby technical reference. - Stop Loss: 1,735.50 GBp, the stated 20-day support. For non-traders, the indicators show improving momentum, but the price is testing resistance before a breakout is confirmed.Summary Data GSK
| Last price | 1,914.00 GBp |
| Change 1 day / 5 days / 1 month | 2.46% / 2.44% / 1.97% |
| Trend / MA-cross | sideways / none |
| SMA20 / SMA50 | 1,817.53 / 1,845.62 |
| RSI (14) / Stochastic %K | 62.8 / 88.7 |
| Bollinger %B / ATR | 98% / 194.85 |
| Support / Resistance 20 days | 1,735.50 / 1,914.00 |
| Data as of | 22 October 2026 22:38 WIB |
Disclaimer: This technical analysis is generated automatically from exchange data (via Yahoo Finance) and indicators calculated by JournalArta, for information and education only. The verdict and the entry, target and stop-loss levels are not investment advice or a solicitation to buy or sell any security. Investment decisions and their risks rest solely with the reader.
Track GSK share price daily: live levels, support/resistance and our full GSK analysis history.