Unilever Stock Technicals: Gains 3.23% on Thursday, Golden Cross Formed
On October 22, 2026: price 4,975.50 GBp, trend uptrend, RSI 65.5, support 4,483.50, resistance 4,975.50. technical analysis of unilever stock.
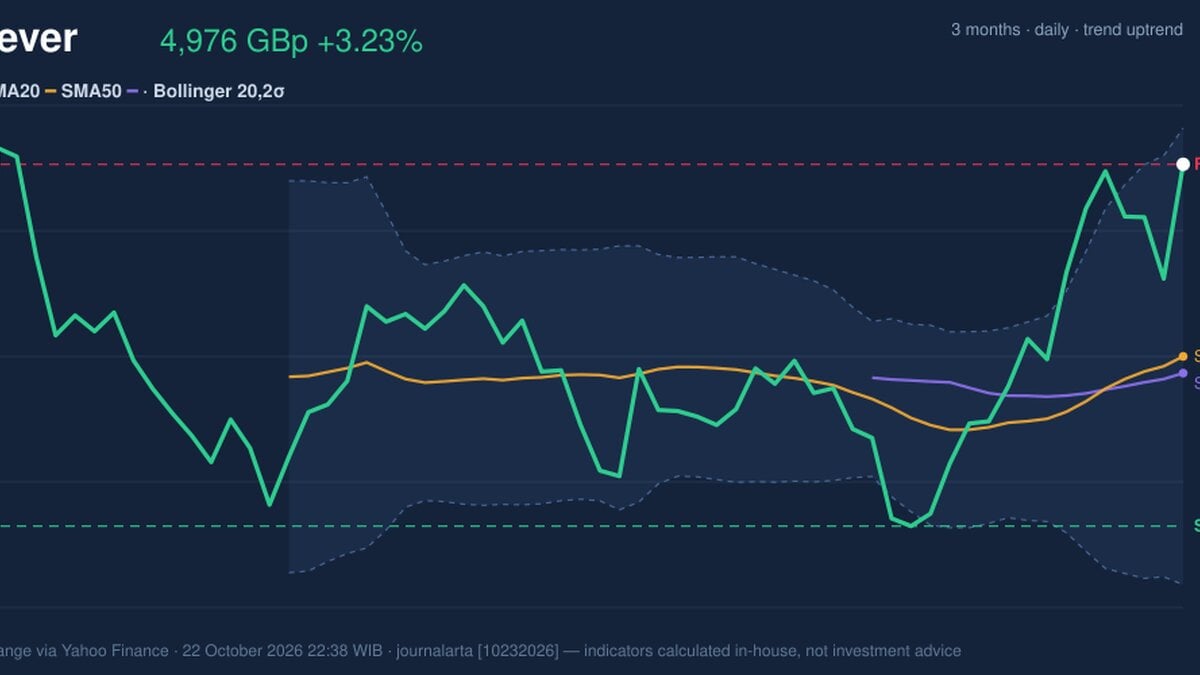
Why Unilever is in focus today
- Closed at a 20-day high (4,975.50)
- Trading near its 3-month high (5,041.00)
- Fresh golden cross: SMA20 crossed above SMA50
- Uptrend confirmed (5-day change 1.22%)
Selected automatically from 16 LSE (UK) stocks by a technical-signal score with daily weighted randomisation — not a recommendation.
Trend & Price Action
The share has risen 1.22% over five days and 5.67% over one month. Its last price sits above both the SMA20 at 4,714.33 GBp and SMA50 at 4,691.51 GBp; the SMA20 has climbed 1.31% over five days. A golden cross—the shorter average moving above the longer one—is often read as evidence that near-term momentum is strengthening relative to the broader trend. That evidence has limits. The close matches the stated 20-day resistance of 4,975.50 GBp, leaving little room before the three-month peak at 5,041.00 GBp. The three-month low is listed as 0.00, which is not a usable reference for judging the share’s trading range. The immediate question is therefore whether the price can sustain a move above current resistance, rather than simply touch it.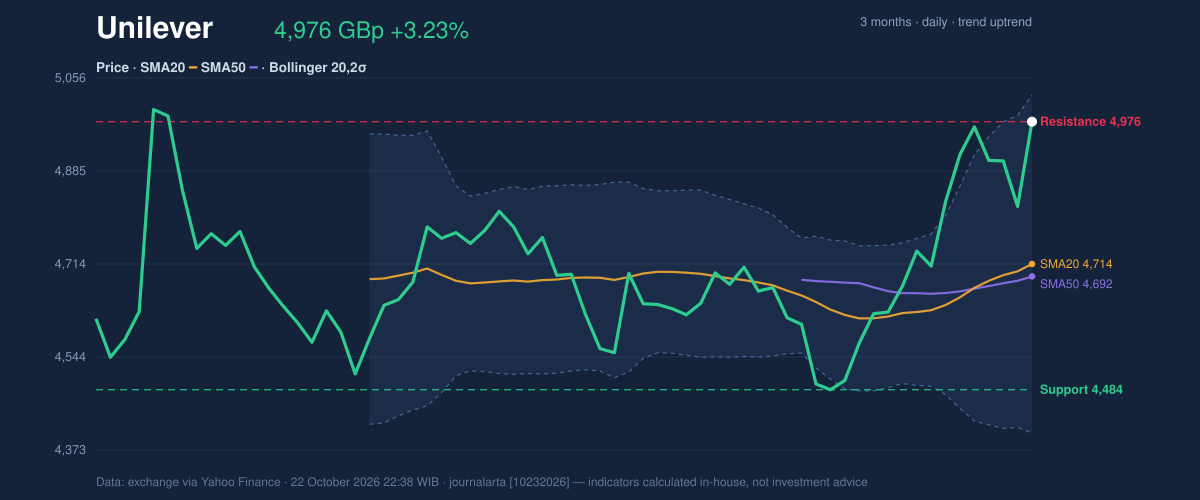
Oscillators & Momentum
Momentum indicators are positive but not uniformly comfortable. The RSI is 65.5, described as neutral: it signals firm buying momentum without, by itself, confirming an extreme. The MACD is also constructive, with its reading of 73.197 above the 43.157 signal line and a positive histogram of 30.040. This supports the view that upward momentum is still in place. The caution comes from the Stochastic %K at 100.0 and %D at 85.5, a reading classified as overbought. That can occur during a strong advance and does not alone predict a reversal, but it suggests the share may be vulnerable to a pause or pullback near resistance. As shown in the momentum chart, the indicators describe a rising market with short-term momentum already stretched.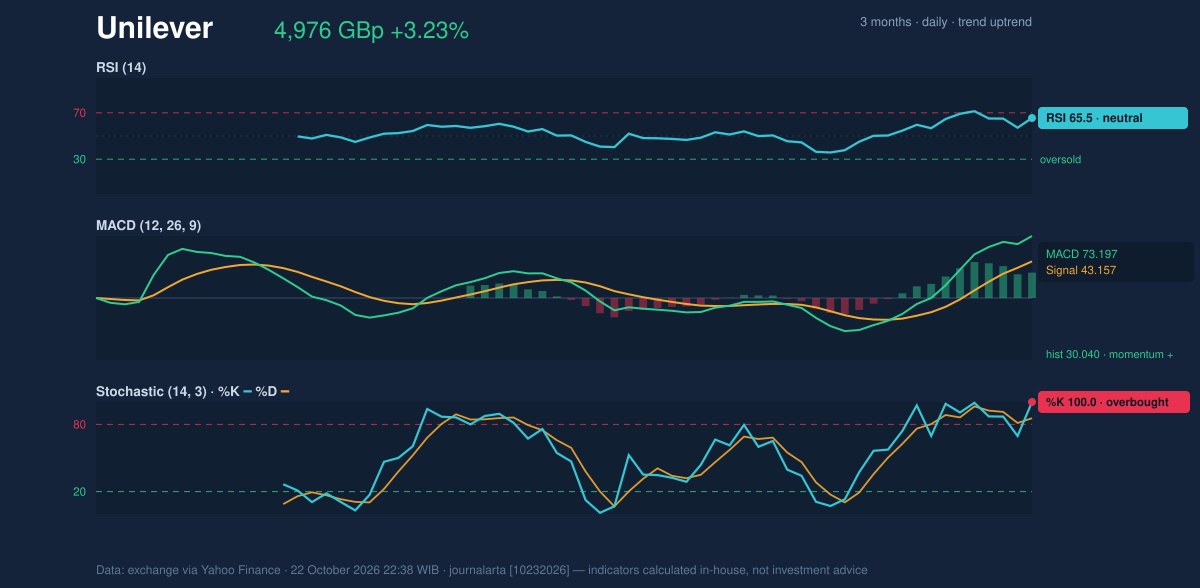
Volatility & Volume
The price is near the upper Bollinger Band at 5,024.73 GBp, with %B at 92%. Bollinger Bands compare price with its recent average and volatility; a high %B means the share is trading close to the top of that range. The band width of 13.2% is normal, not unusually tight, so the data do not point to a volatility squeeze that might precede a sharp breakout. The 14-day ATR is 443.71 GBp, or 8.9% of the share price, indicating high measured volatility. In plain terms, ordinary price swings have been large enough to make nearby technical levels less precise as short-term guides. Volume is a more direct concern: the latest reading is 100 against a 20-day average of 2,840,568, classified as thin. The reported OBV is rising, which suggests cumulative volume has generally supported the advance, but the latest session’s exceptionally low volume does not provide strong confirmation of the close at resistance.Key Levels & Scenarios
The nearest stated resistance is 4,975.50 GBp, with the three-month high at 5,041.00 GBp as the next reference in the supplied data. A sustained move above that area would strengthen the breakout case, particularly if accompanied by fuller trading activity. Failure to hold near the current level could bring the moving-average area around 4,714.33 GBp into focus; the 20-day support is 4,483.50 GBp. Those are conditional markers, not forecasts. The high ATR means a move toward either area could be sizeable, while the overbought Stochastic argues against treating a test of resistance as confirmation on its own.Technical Verdict: HOLD (wait & see)
HOLD (wait & see) is the clearest reading of the mixed technical picture. The golden cross and price above both moving averages support the uptrend; MACD remains positive; but the share is at 20-day resistance, Stochastic is overbought, and the latest volume is too thin to validate the breakout. The verdict is invalidated if price falls below the stated 4,483.50 GBp support.- Ideal Entry Range: 4,714.33–4,483.50 GBp, using the SMA20 and 20-day support as reference levels.
- Exit Target (Target Price): 5,041.00 GBp, the stated three-month high.
- Stop Loss protection: 4,403.92 GBp, the lower Bollinger Band.
| Indicator | Reading |
|---|---|
| Last price | 4,975.50 GBp |
| SMA20 / SMA50 | 4,714.33 / 4,691.51 GBp |
| RSI / Stochastic | 65.5 / %K 100.0, %D 85.5 |
| MACD / signal / histogram | 73.197 / 43.157 / 30.040 |
| Bollinger upper / middle / lower | 5,024.73 / 4,714.33 / 4,403.92 GBp |
| Support / resistance (20 trading days) | 4,483.50 / 4,975.50 GBp |
Summary Data Unilever
| Last price | 4,975.50 GBp |
| Change 1 day / 5 days / 1 month | 3.23% / 1.22% / 5.67% |
| Trend / MA-cross | uptrend / golden |
| SMA20 / SMA50 | 4,714.33 / 4,691.51 |
| RSI (14) / Stochastic %K | 65.5 / 100.0 |
| Bollinger %B / ATR | 92% / 443.71 |
| Support / Resistance 20 days | 4,483.50 / 4,975.50 |
| Data as of | 22 October 2026 22:38 WIB |
Disclaimer: This technical analysis is generated automatically from exchange data (via Yahoo Finance) and indicators calculated by JournalArta, for information and education only. The verdict and the entry, target and stop-loss levels are not investment advice or a solicitation to buy or sell any security. Investment decisions and their risks rest solely with the reader.
Track Unilever share price daily: live levels, support/resistance and our full Unilever analysis history.