NetEase Golden Cross Formed: Stock Drops 6.53% (October 22, 2026)
On October 22, 2026: price 181.80 HKD, trend sideways, RSI 39.6, support 180.90, resistance 199.10. technical analysis of netease stock.
Trend & Price Action
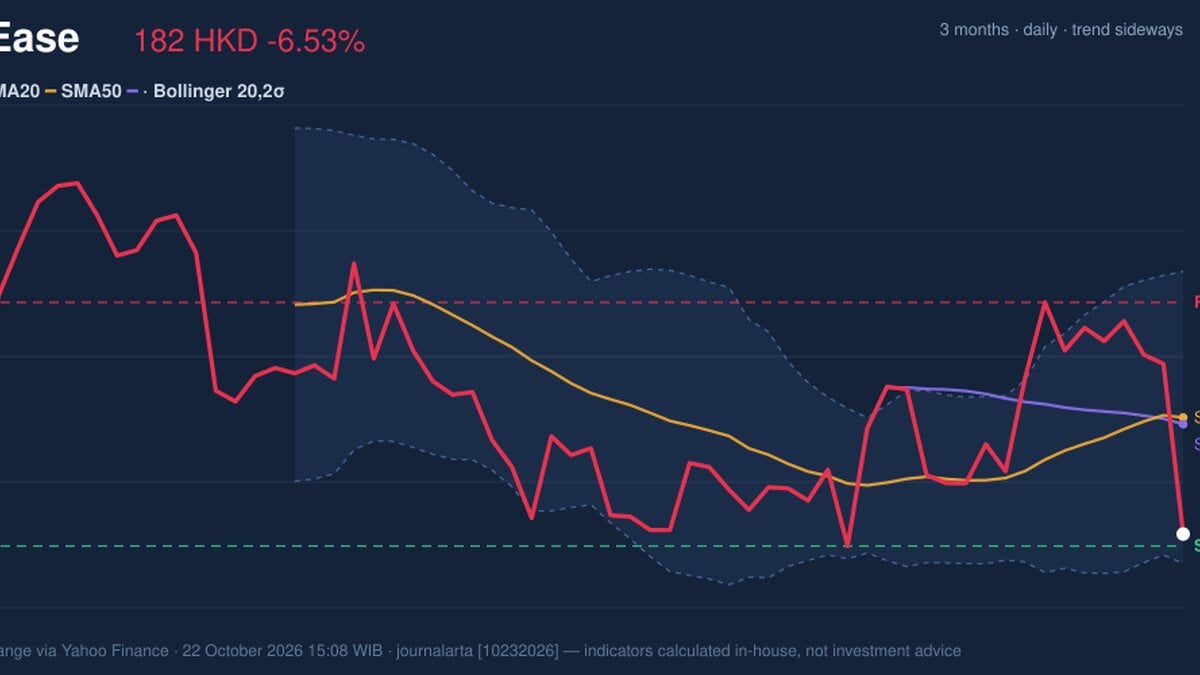
NetEase is trading below both its 20-day simple moving average (SMA) of HK$190.50 and its 50-day SMA of HK$190.00. That leaves the share price beneath a closely grouped band of potential resistance. The averages still show a golden cross, but the signal describes a recent change in the averages, not a guarantee that prices will keep rising. With the broader trend classified as sideways, the cross has yet to overcome the pull of the latest sell-off. The share is now near the bottom of its 20-trading-day range, between support at HK$180.90 and resistance at HK$199.10. It is also close to the three-month low of HK$179.00. That proximity makes the next move around support particularly informative: holding there could suggest the sell-off is meeting buyers, while a break would put the three-month low into focus.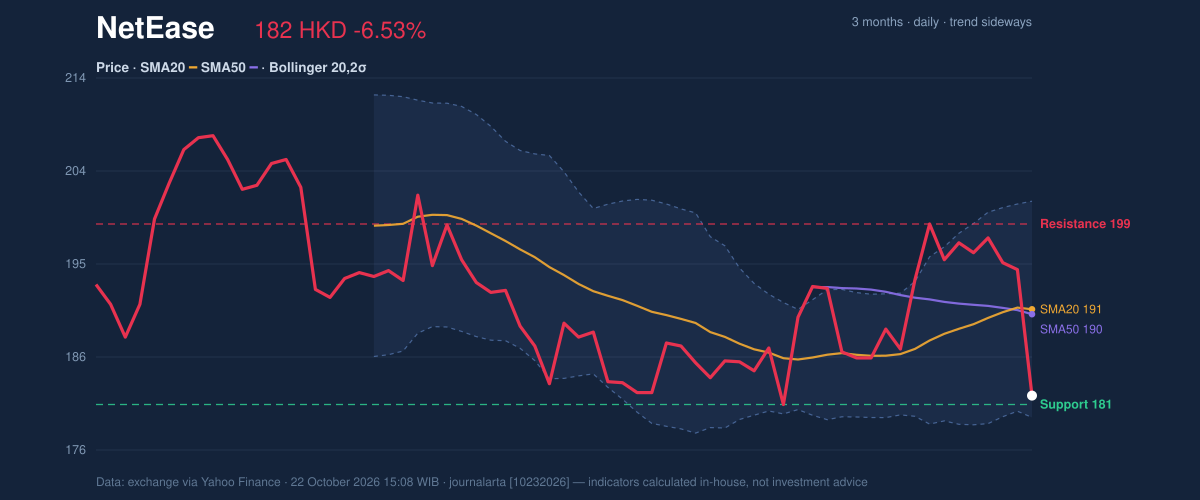
Oscillators & Momentum
The momentum indicators are mixed, but their short-term message is cautious. RSI is 39.6, in neutral territory, below the level usually associated with an overbought market but not low enough to confirm that selling has become extreme. The Stochastic reading is more stretched: %K at 5.7 is below %D at 44.3, indicating an oversold condition. Oversold readings can accompany a rebound, but they can also persist while prices continue falling. The MACD adds to that caution. Its histogram has turned negative at -0.240, while the MACD line at 0.957 sits below its signal line at 1.197. This suggests that near-term momentum has weakened even as the moving averages retain their golden cross. The signals are therefore not aligned: the cross reflects the earlier trend, while MACD captures the more recent loss of strength.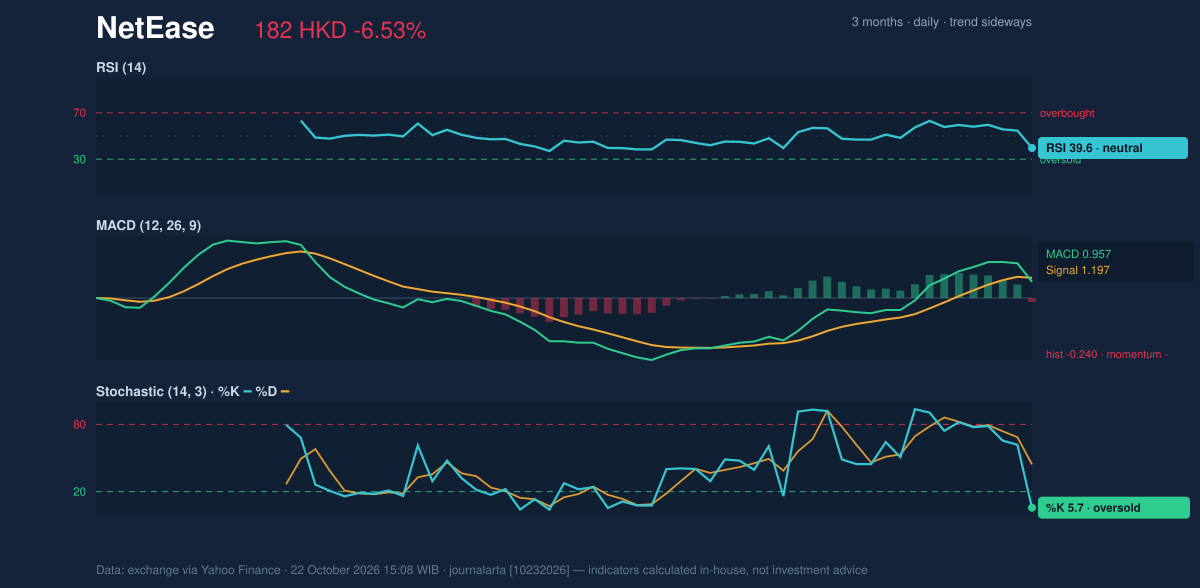
Volatility & Trading Activity
NetEase is near the lower Bollinger Band, at HK$179.60, with the band position (%B) at 10%. Bollinger Bands map price against a recent range of movement; a low %B means the share is trading close to the lower edge, not that a rebound is assured. The band width is 11.4%, described as normal, so the data do not point to an unusually compressed or expanded trading range. Average True Range (ATR), a measure of typical price movement, is HK$6.19, or 3.4% of the share price. That is consistent with a volatile session but not, on its own, evidence of a lasting trend change. Volume was 8,238,007 shares, about 1.5 times the 20-day average of 5,571,701. Higher turnover during a decline indicates stronger participation in the move; falling On-Balance Volume (OBV), which tracks whether volume accompanies rising or falling prices, reinforces the concern that selling pressure is accumulating.Key Levels & Scenarios
The immediate test is the HK$180.90 support area, with the lower Bollinger Band at HK$179.60 and the three-month low at HK$179.00 nearby. If the price holds that cluster, the oversold Stochastic reading leaves room for a recovery attempt. But regaining the SMA20 at HK$190.50 would be needed to improve the short-term chart, with resistance at HK$199.10 beyond it. A sustained move below the nearby support levels would weaken the case that the golden cross can steady the stock. Conversely, a rebound that remains beneath the moving averages would still face overhead resistance. The central signal is a tug-of-war: oversold conditions and a golden cross meet negative MACD, falling OBV and a high-volume decline.Technical Verdict: HOLD (wait & see)
The indicators support a wait-and-see reading rather than a clear directional signal: - Reasons: the negative MACD histogram and falling OBV confirm short-term pressure; the price is below both moving averages; and the golden cross and oversold Stochastic offer opposing, but not yet confirmed, support. - Invalidation: this verdict is invalidated if the price falls below HK$179.00, the three-month low. - Ideal entry range: HK$179.60–HK$190.50, bounded by the lower Bollinger Band and SMA20. - Exit target: HK$199.10, the 20-trading-day resistance. - Stop-loss protection: below HK$179.00, the three-month low. In plain English, the chart has not yet shown whether buyers can defend the recent lows or whether the decline has further to run.Data: exchange figures via Yahoo Finance, as of October 22, 2026, 15:08 WIB.
Why NetEase is in focus today
- One-day move of -6.53%, about 1.9× its average daily range (ATR)
- Trading near its 3-month low (179.00)
- Fresh golden cross: SMA20 crossed above SMA50
- MACD histogram has just turned negative
Selected automatically from 16 HKEX (Hong Kong) stocks by a technical-signal score with daily weighted randomisation — not a recommendation.
Summary Data NetEase
| Last price | 181.80 HKD |
| Change 1 day / 5 days / 1 month | -6.53% / -7.81% / -1.84% |
| Trend / MA-cross | sideways / golden |
| SMA20 / SMA50 | 190.50 / 190.00 |
| RSI (14) / Stochastic %K | 39.6 / 5.7 |
| Bollinger %B / ATR | 10% / 6.19 |
| Support / Resistance 20 days | 180.90 / 199.10 |
| Data as of | 22 October 2026 15:08 WIB |
Disclaimer: This technical analysis is generated automatically from exchange data (via Yahoo Finance) and indicators calculated by JournalArta, for information and education only. The verdict and the entry, target and stop-loss levels are not investment advice or a solicitation to buy or sell any security. Investment decisions and their risks rest solely with the reader.
Track NetEase share price daily: live levels, support/resistance and our full NetEase analysis history.