UOB Stock Drops 0.29% on Thursday, Momentum Gains
On October 22, 2026: price 41.88 SGD, trend sideways, RSI 50.5, support 39.96, resistance 43.72. technical analysis of uob stock. UOB Stock Drops — full…
Why UOB is in focus today
- MACD histogram has just turned positive
Selected automatically from 16 SGX (Singapore) stocks by a technical-signal score with daily weighted randomisation — not a recommendation.
Trend & Price Action
UOB’s shares were down 1.46% over one month but up 0.46% over five trading days, a mixed pattern consistent with consolidation. The latest price sits below the S$42.03 SMA20—the average closing price over 20 sessions—yet above the S$41.68 SMA50. The 20-day average’s slope is mildly negative, and there has been no new moving-average crossover. Together, those readings suggest the shorter-term trend has softened without confirming a broader breakdown. The share price is at 51% of its 20-day range, between S$39.96 support and S$43.72 resistance. It is also within the three-month span of S$39.40 to S$43.94. This middle-of-range position means neither buyers nor sellers have established clear control. As shown in the chart, the price is near the Bollinger Band midpoint, with the bands at S$39.84 and S$44.22. A Bollinger Band measures how far a price has moved from its recent average; the current 10.4% band width is normal, not unusually compressed or expanded. The 47% %B reading places the price just below the midpoint, consistent with consolidation rather than an extreme move.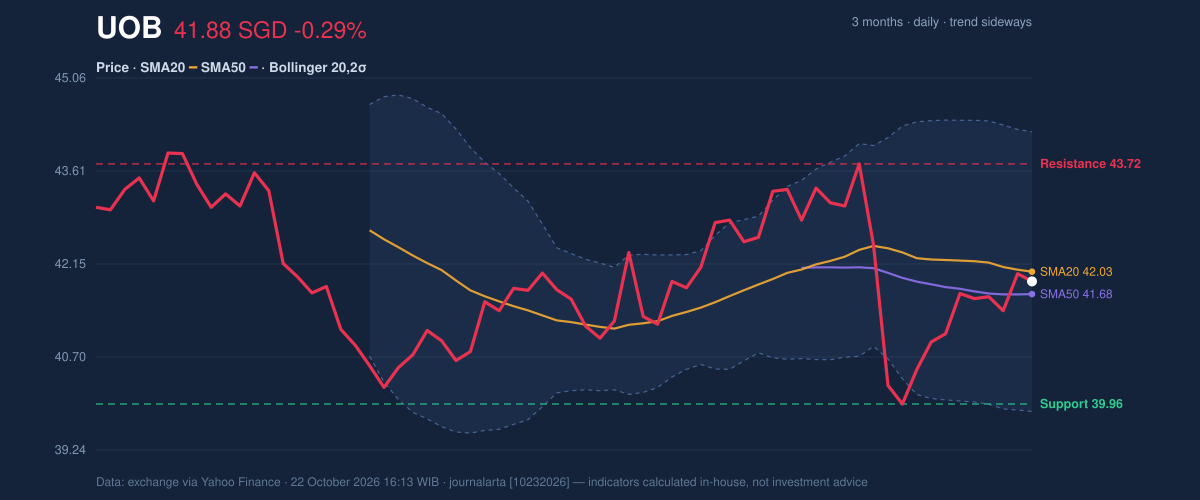
Oscillators & Momentum
The momentum indicators are broadly neutral, with one early sign of improvement. RSI is 50.5, while Stochastic readings are %K 57.4 and %D 54.5; neither points to an overbought or oversold market. RSI compares recent gains with losses, while Stochastic gauges where the latest close sits within its recent trading range. The MACD remains below zero at -0.134, but its signal line is slightly lower at -0.142, leaving the histogram positive at 0.008. The histogram measures the gap between MACD and its signal line, so a positive reading indicates that downward momentum has eased relative to that signal. It is a tentative improvement, not proof of a sustained uptrend—particularly while the share price remains below the SMA20. As shown in the chart, the MACD turn is not yet reinforced by a strong directional reading from RSI or Stochastic.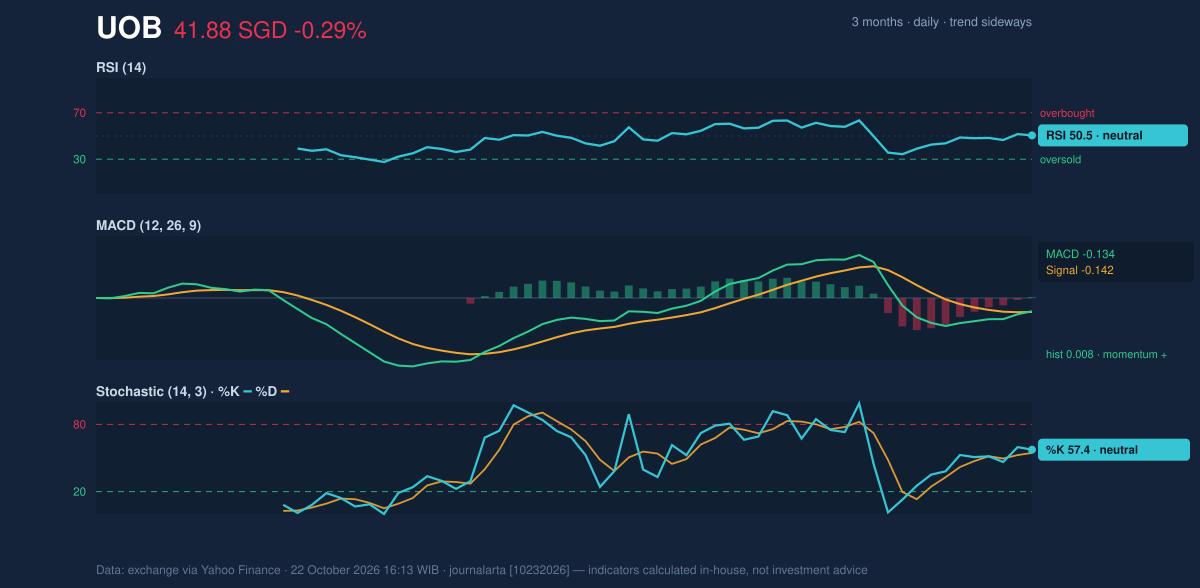
Volatility & Volume
Average true range, a measure of typical daily price movement, is S$0.92, or 2.2% of the share price. That points to moderate volatility: the stock is moving, but the supplied data do not show an exceptional expansion in day-to-day swings. Volume was 2,720,360 shares, about 0.6 times the 20-day average of 4,284,188. That thin participation makes the latest price action less persuasive as evidence of a broad shift in investor positioning. On the other hand, on-balance volume, which tracks whether volume flows more heavily on rising or falling sessions, is rising. The contrast suggests some underlying accumulation, though the lighter-than-usual turnover tempers that signal.Technical Verdict: HOLD (wait & see)
HOLD (wait & see) is the clearest technical reading: the positive MACD histogram and rising OBV offer support, but neutral oscillators, below-average volume and a price below the SMA20 leave confirmation incomplete. The verdict is invalidated if the price falls below S$39.96, the 20-day support level.- Ideal entry range: S$41.68–S$42.03, spanning the SMA50 and SMA20.
- Exit target: S$43.72, the 20-day resistance level.
- Stop-loss protection: S$39.84, the lower Bollinger Band.
| Indicator | Reading |
|---|---|
| Latest price | S$41.88 |
| Daily change | -0.29% |
| Five-day / one-month change | +0.46% / -1.46% |
| SMA20 / SMA50 | S$42.03 / S$41.68 |
| RSI / Stochastic | 50.5 / %K 57.4, %D 54.5 |
| MACD / signal / histogram | -0.134 / -0.142 / +0.008 |
| Support / resistance | S$39.96 / S$43.72 |
| Volume / 20-day average | 2,720,360 / 4,284,188 shares |
Summary Data UOB
| Last price | 41.88 SGD |
| Change 1 day / 5 days / 1 month | -0.29% / 0.46% / -1.46% |
| Trend / MA-cross | sideways / none |
| SMA20 / SMA50 | 42.03 / 41.68 |
| RSI (14) / Stochastic %K | 50.5 / 57.4 |
| Bollinger %B / ATR | 47% / 0.92 |
| Support / Resistance 20 days | 39.96 / 43.72 |
| Data as of | 22 October 2026 16:13 WIB |
Disclaimer: This technical analysis is generated automatically from exchange data (via Yahoo Finance) and indicators calculated by JournalArta, for information and education only. The verdict and the entry, target and stop-loss levels are not investment advice or a solicitation to buy or sell any security. Investment decisions and their risks rest solely with the reader.
Track UOB share price daily: live levels, support/resistance and our full UOB analysis history.