Testing Support Level, ST Engineering Stock Drops 0.78% on Thursday
On October 22, 2026: price 10.23 SGD, trend sideways, RSI 38.5, support 10.23, resistance 11.23. technical analysis of st engineering stock.
By matthew jonathan
October 22, 20264 min read
Testing Support Level, ST Engineering Stock Drops 0.78% on Thursday
Singapore Technologies Engineering traded at S$10.23 on the Singapore Exchange on Oct. 22, down 0.78% from the previous close, with the stock sitting at its 20-trading-day support and below both key moving averages. The shares are worth watching because JournalArta has not covered them in the past 14 days, while the chart presents a clear tension: short-term momentum is weak, but the Stochastic oscillator is deeply oversold.
Trend & Price Action
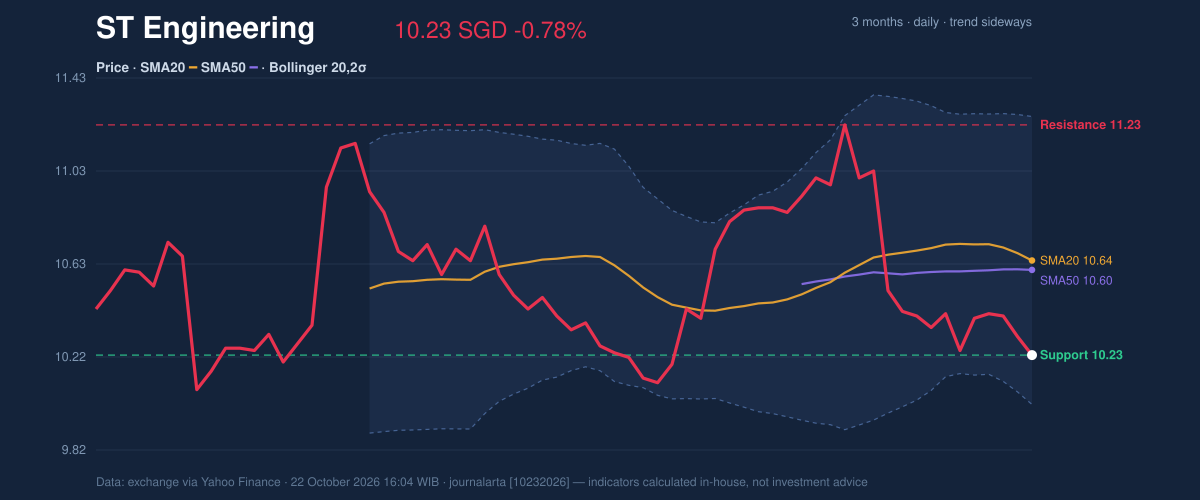
ST Engineering’s price has slipped 5.80% over one month and 0.20% over five trading days. The broader pattern remains sideways, but the falling 20-day simple moving average (SMA) — down 0.67% over five days — points to deteriorating near-term momentum. At S$10.23, the stock is below its SMA20 of S$10.64 and SMA50 of S$10.60. There has been no new moving-average crossover, so the chart offers no fresh signal that the longer trend has decisively changed.
The price is at the bottom of its stated 20-day range, with support at S$10.23 and resistance at S$11.23. That positioning makes the next move important: a hold at support could provide a base for recovery, while a break below it would weaken the current range structure. The three-month low of S$9.83 is a further reference point, not a guaranteed floor.
The price is testing support, not confirming a rebound.
As shown in the chart, the price sits near the lower Bollinger Band, while the moving averages remain overhead.
3-month price action chart of ST Engineering: price, SMA20/50, Bollinger, support & resistance. Data: exchange via Yahoo Finance.
Oscillators & Momentum
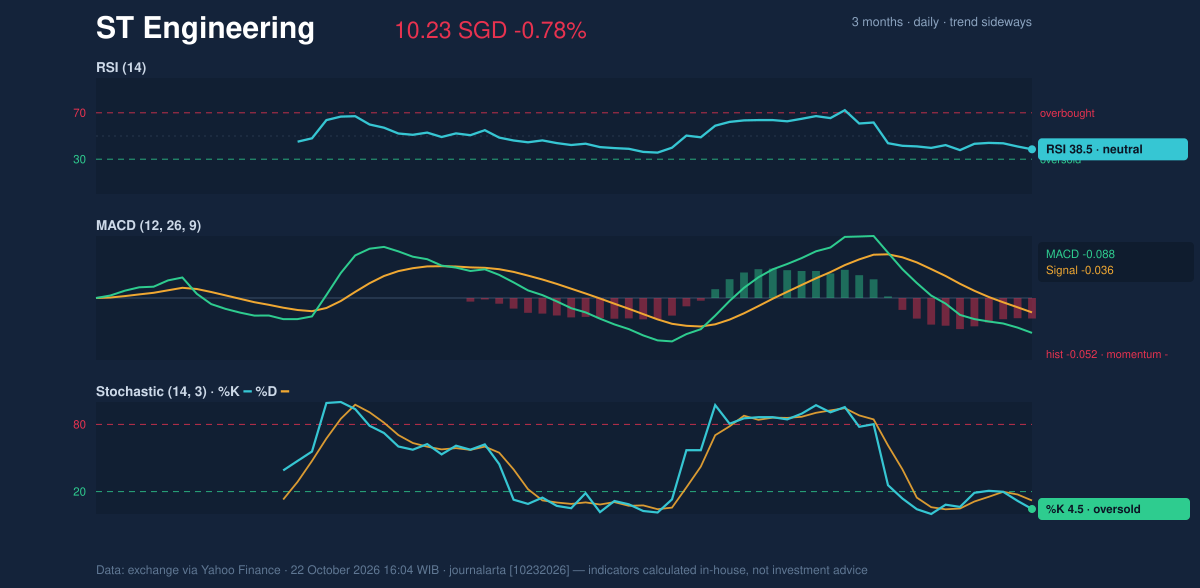
The indicators are sending mixed signals. The 14-day Relative Strength Index (RSI), which gauges the pace of recent gains and losses, is 38.5 and classified as neutral. The Stochastic oscillator is more extreme: %K is 4.5 and %D is 12.0, both indicating oversold conditions. That can mean selling has become stretched, but it does not by itself show that buyers have returned.
The Moving Average Convergence Divergence (MACD), a measure of trend momentum, remains negative at -0.088, below its -0.036 signal line, with a negative histogram of -0.052. This alignment suggests downward momentum is still in control. In other words, the Stochastic reading raises the possibility of a pause, while MACD has yet to confirm a reversal.
Stochastic is oversold, but MACD remains negative.
The momentum chart helps distinguish that potential exhaustion from a confirmed turn.
Momentum chart of ST Engineering: RSI(14), MACD, Stochastic. Data: exchange via Yahoo Finance.
Volatility & Volume
The Bollinger Bands span S$10.02 to S$11.27, with the middle band at S$10.64. The price’s position at 17% of the band range places it close to the lower boundary. The band width of 11.8% is described as normal, rather than unusually tight or expanding sharply, so the data do not point to a volatility squeeze or a major breakout signal. The Average True Range (ATR) is S$0.23, or 2.2% of the share price, indicating moderate day-to-day movement.
Trading volume was 3,644,200 shares, about 0.8 times the 20-day average of 4,717,392. On-Balance Volume (OBV) is falling, meaning trading activity has not yet provided evidence that accumulation is offsetting the price weakness. Thin participation can make a move less persuasive; a recovery would be more convincing if volume and OBV improved alongside price.
Key Levels & Scenarios
The immediate test is whether S$10.23 holds. A sustained move above the SMA20 at S$10.64 would be an early sign of repair, though resistance at S$11.23 remains the more important hurdle. The upper Bollinger Band at S$11.27 and the three-month high at S$11.29 sit just beyond that resistance zone, creating a cluster of overhead levels.
Support is S$10.23; resistance is S$11.23. A break above resistance would improve the price structure, while a fall through support would expose the lower three-month reference at S$9.83. The lower Bollinger Band at S$10.02 is another nearby chart level, but neither band nor support guarantees that selling will stop there.
Technical Verdict: HOLD (wait & see)
The indicators support a neutral, cautious reading rather than a clear directional signal:
- Entry range: S$10.23–S$10.64, bounded by current support and the SMA20; this is a chart reference, not a forecast.
- Exit target: S$11.23, the stated resistance level.
- Stop-loss protection: S$10.02, the lower Bollinger Band.
- Invalidation: The verdict is invalidated if the price falls below S$10.23 support.
The case for waiting rests on the oversold Stochastic reading, the negative MACD and the price’s position below both moving averages. For non-traders, the chart shows weakness with a possible short-term pause, but no confirmed recovery.
| Indicator | Reading |
|---|---:|
| Last price | S$10.23 |
| SMA20 / SMA50 | S$10.64 / S$10.60 |
| RSI / Stochastic | 38.5 / oversold |
| MACD histogram | -0.052 |
| Bollinger lower / upper | S$10.02 / S$11.27 |
| Volume vs. 20-day average | 0.8× |
Summary Data ST Engineering
Last price
10.23 SGD
Change 1 day / 5 days / 1 month
-0.78% / -0.20% / -5.80%
Trend / MA-cross
sideways / none
SMA20 / SMA50
10.64 / 10.60
RSI (14) / Stochastic %K
38.5 / 4.5
Bollinger %B / ATR
17% / 0.23
Support / Resistance 20 days
10.23 / 11.23
Data as of
22 October 2026 16:04 WIB
Disclaimer: This technical analysis is generated automatically from exchange data (via Yahoo Finance) and indicators calculated by JournalArta, for information and education only. The verdict and the entry, target and stop-loss levels are not investment advice or a solicitation to buy or sell any security. Investment decisions and their risks rest solely with the reader.