Testing Support Level, JD.com Stock Drops 4.28% on Thursday
On October 22, 2026: price 98.30 HKD, trend downtrend, RSI 33.0, support 98.30, resistance 108.50. technical analysis of jd.com stock. Testing Support Level —…
Why JD.com is in focus today
- One-day move of -4.28%, about 1.4× its average daily range (ATR)
- Volume at 1.7× the 20-day average
- Closed at a 20-day low (98.30)
- Trading near its 3-month low (97.40)
- MACD histogram has just turned negative
- Breaking out of a Bollinger squeeze (band width 7.6%)
- Downtrend extending (5-day change -7.35%)
Selected automatically from 16 HKEX (Hong Kong) stocks by a technical-signal score with daily weighted randomisation — not a recommendation.
Trend & Price Action
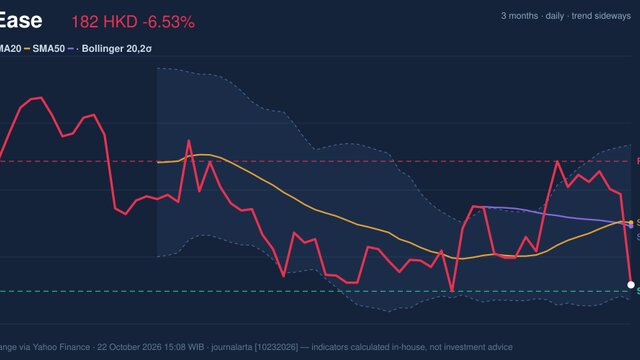
JD.com traded below its 20-day simple moving average, or SMA20, at HK$104.39 and its 50-day average at HK$107.89. Both are above the last price, leaving the shares in a downtrend; the SMA20’s slope is also negative, falling 0.54% over five sessions. There has been no new crossover between the averages, so the latest signal is persistent weakness rather than a fresh change in trend. The stock ended at the 20-session support level of HK$98.30, the bottom of its stated 20-session range. It is also close to the three-month low of HK$97.40. This clustering matters: a nearby low may attract buyers, but a failure to hold it would leave the chart without a stronger support level identified in the supplied data. As shown in the chart, the price remains below the Bollinger middle band, which coincides with the SMA20, while the lower band sits at HK$100.42. The last price of HK$98.30 is below that lower band, a sign that selling has pushed beyond the recent range’s usual boundary. Such a move can reflect strong downside pressure; by itself, it does not confirm that a rebound has begun.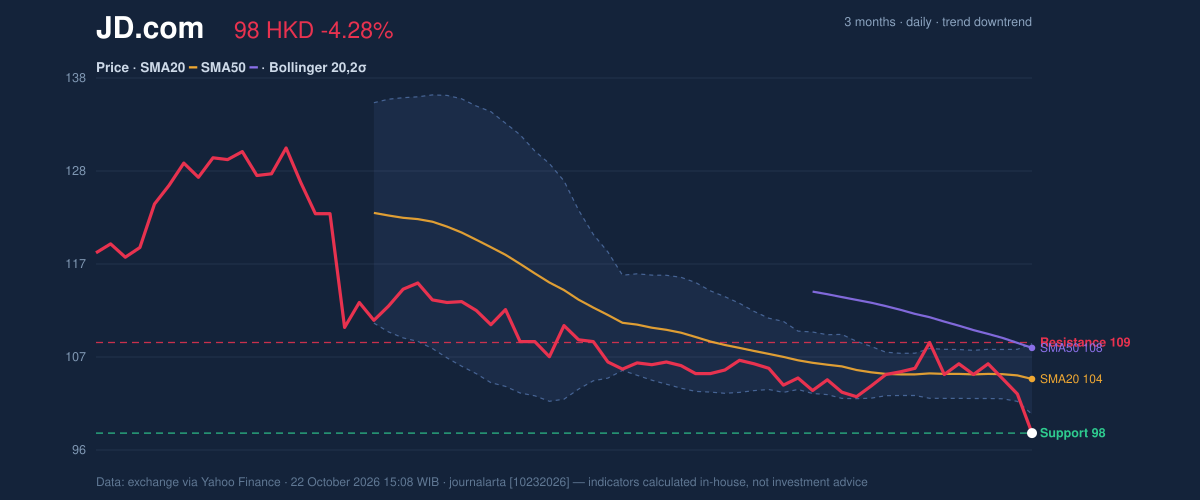
Oscillators & Momentum
Momentum readings are weak, but they show different degrees of strain. RSI is 33.0, classified as neutral in the supplied data, though close to the level commonly associated with oversold conditions. RSI compares the scale of recent gains with losses; a low reading can indicate sustained selling, but it is not a timing signal on its own. The Stochastic oscillator is more extreme: %K at 7.8 and %D at 27.3 are in oversold territory. That suggests the price has fallen sharply relative to its recent range. Oversold conditions can precede a pause or bounce, yet they can persist when a downtrend is strong. The MACD offers little confirmation of a reversal. Its value is -1.472, below the -1.303 signal line, with a negative histogram of -0.169. The histogram has newly turned negative, indicating that short-term momentum has shifted against the stock. That bearish signal contrasts with the possibility of a technical rebound implied by the Stochastic reading.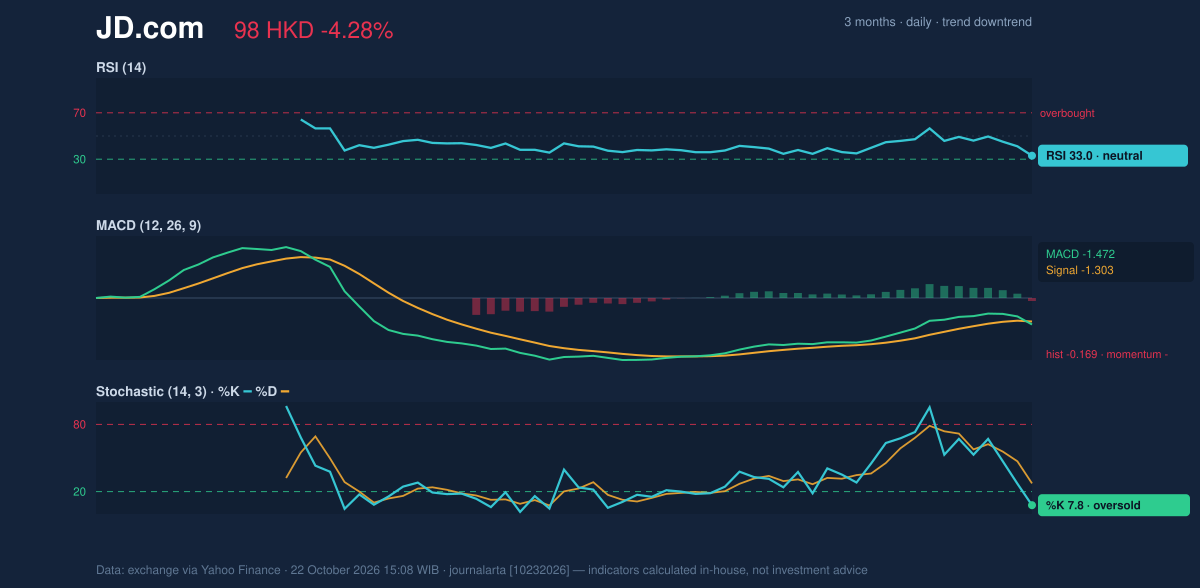
Volatility, Volume & Key Levels
The Bollinger band width is 7.6% and is narrowing, a pattern known as a squeeze. It means recent price movement has contracted relative to its own history; it does not say which direction a breakout will take. The close below the lower band, following the squeeze, raises the risk of an outsized move, but the direction needs confirmation. ATR stands at HK$3.09, or 3.1% of the share price, indicating moderate volatility by the supplied measure. Volume reached 11,463,429 shares, or 1.7 times its 20-session average of 6,578,491. That surge shows the decline drew stronger participation than usual. On-balance volume (OBV) is also falling, meaning cumulative volume is consistent with selling pressure rather than pointing to accumulation. The immediate reference points are support at HK$98.30 and resistance at HK$108.50. A sustained hold above support would be an early sign that selling is stabilising; a break below it would put the three-month low of HK$97.40 in focus. On the upside, reclaiming the resistance area would be a more meaningful test of whether the stock can recover toward its moving averages.Technical Verdict: HOLD
The indicators support a wait-and-see technical stance: price is below both moving averages, MACD momentum is negative, and falling OBV confirms the pressure; however, the Stochastic is oversold and the shares are near the three-month low, leaving room for a short-term rebound. - Ideal entry range: HK$97.40–HK$100.42, bounded by the three-month low and lower Bollinger band. - Exit target: HK$108.50, the stated 20-session resistance. - Stop-loss protection: Below HK$97.40, using the three-month low as the invalidation level. - Invalidation: The HOLD verdict is invalidated if price breaks below HK$97.40. For non-traders, the chart shows heavy selling near a recent low, but not yet a confirmed turn higher.| Indicator | Reading |
|---|---|
| Last price | HK$98.30 |
| SMA20 / SMA50 | HK$104.39 / HK$107.89 |
| RSI / Stochastic | 33.0 / %K 7.8, %D 27.3 |
| MACD / histogram | -1.472 / -0.169 |
| Volume / 20-session average | 11,463,429 / 6,578,491 |
| Support / resistance | HK$98.30 / HK$108.50 |
| Three-month high / low | HK$130.90 / HK$97.40 |
Summary Data JD.com
| Last price | 98.30 HKD |
| Change 1 day / 5 days / 1 month | -4.28% / -7.35% / -7.70% |
| Trend / MA-cross | downtrend / none |
| SMA20 / SMA50 | 104.39 / 107.89 |
| RSI (14) / Stochastic %K | 33.0 / 7.8 |
| Bollinger %B / ATR | -27% / 3.09 |
| Support / Resistance 20 days | 98.30 / 108.50 |
| Data as of | 22 October 2026 15:08 WIB |
Disclaimer: This technical analysis is generated automatically from exchange data (via Yahoo Finance) and indicators calculated by JournalArta, for information and education only. The verdict and the entry, target and stop-loss levels are not investment advice or a solicitation to buy or sell any security. Investment decisions and their risks rest solely with the reader.
Track JD.com share price daily: live levels, support/resistance and our full JD.com analysis history.