CAT Stock Analysis: Drops 2.42%, RSI Oversold
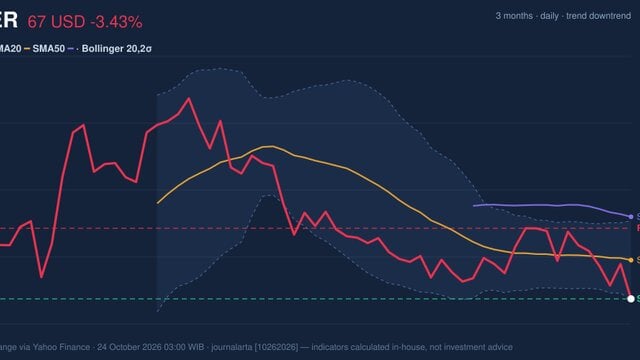
On October 23, 2026: price 687.00 USD, trend downtrend, RSI 26.7, support 687.00, resistance 863.44. technical analysis of cat stock. CAT Stock Analysis — full…
Trend & Price Action
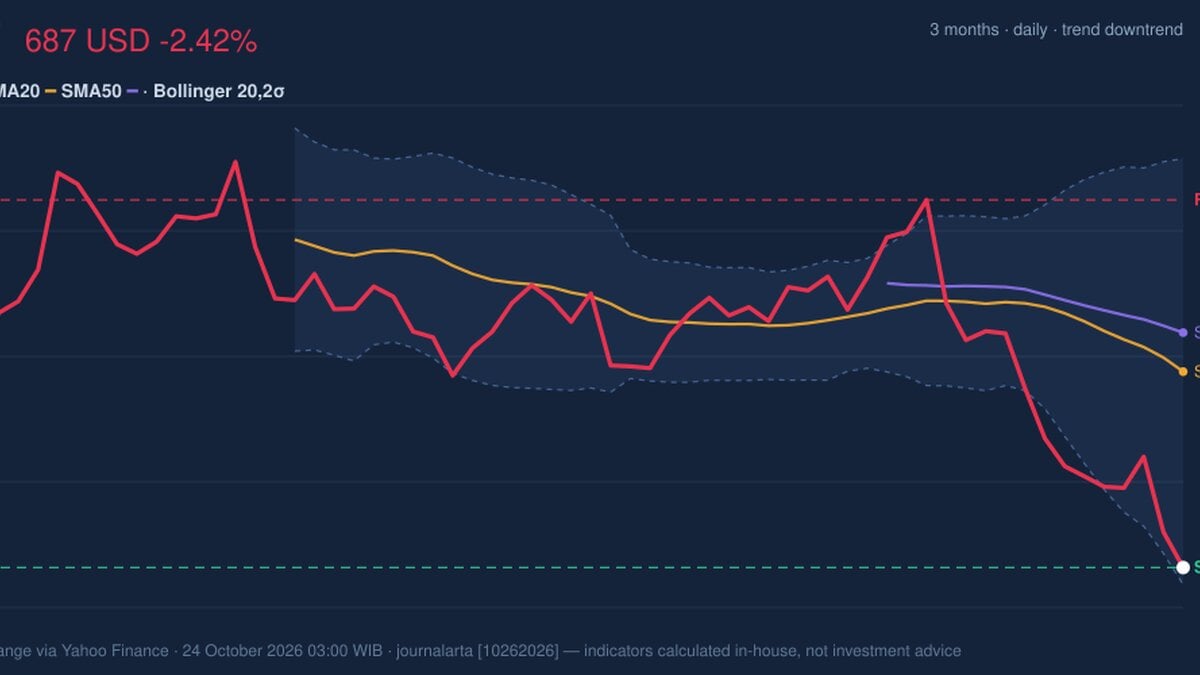
At $687.00, Caterpillar trades below both its 20-day simple moving average (SMA) of $781.05 and its 50-day SMA of $799.74. A simple moving average tracks the average closing price over a set period; trading below both indicates that recent price action remains weaker than its recent and intermediate-term averages. The 20-day average is also falling, down 2.99% over five trading days. There has been no new moving-average crossover, so the signal is not a fresh technical cross but an established downtrend. The price sits at the bottom of its 20-day range, with support at $687.00 and resistance at $863.44. It is also close to the three-month low of $681.23. The distance between the current price and that low is small enough to make the area an important test: holding near it could help stabilize the chart, while a break below it would deepen the weakness. The near-term rebound case faces substantial resistance from the declining averages overhead. The price is testing the floor, not confirming a recovery.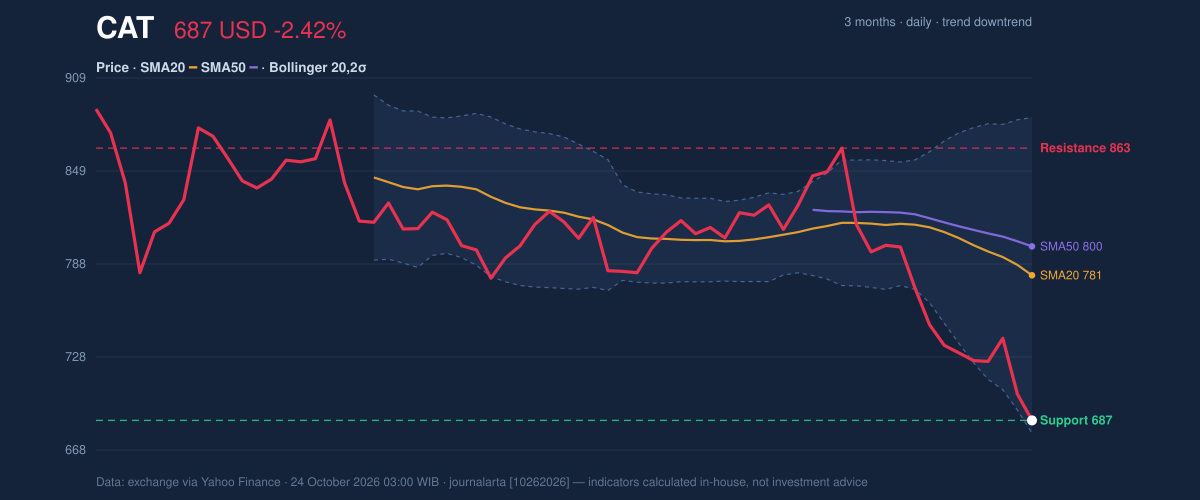
Oscillators & Momentum
The Relative Strength Index (RSI), which gauges the pace and strength of recent price moves, is 26.7—below the commonly watched 30 threshold for an oversold reading. The Stochastic indicator, which compares a recent close with the range of prices over a set period, is similarly stretched: %K is 2.9 and %D is 9.6. Both RSI and Stochastic are in oversold territory, meaning selling has pushed the shares sharply lower relative to recent trading. That condition can precede a bounce, but it is not a timing signal by itself: prices can remain oversold while a downtrend continues. MACD, a trend-and-momentum measure, reinforces the weaker reading. It stands at -29.225 against a signal line of -19.263, with a negative histogram of -9.962. The negative histogram means downside momentum remains pronounced rather than showing a clear turn. Oversold oscillators and negative MACD are sending different messages about exhaustion and direction: the first flags how far the stock has fallen, while MACD says the prevailing pressure is still downward.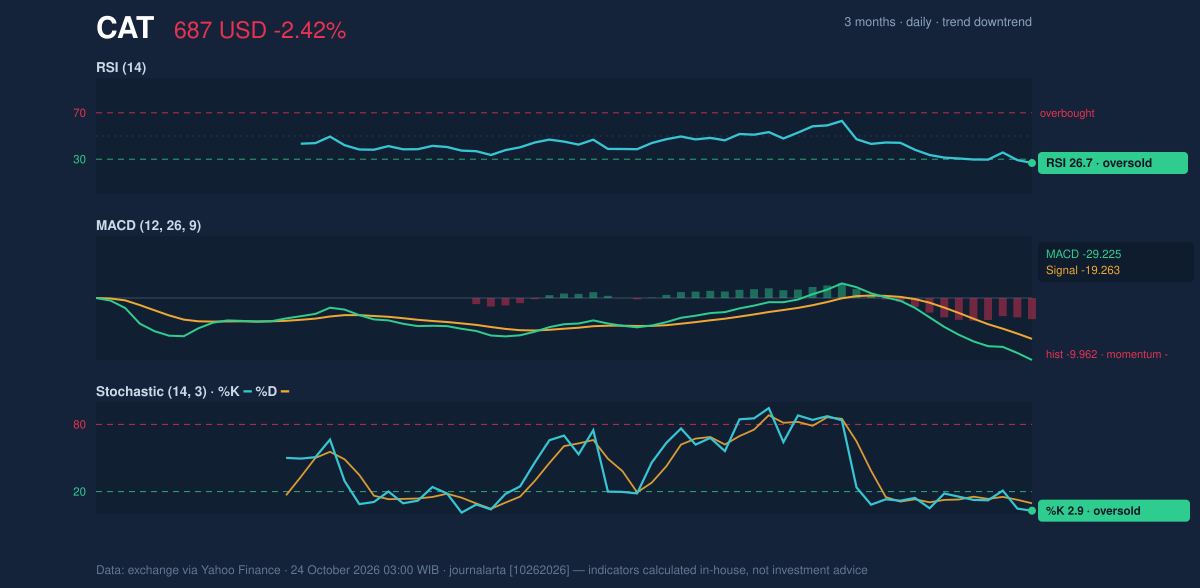
Volatility, Volume & Key Levels
Caterpillar’s Bollinger Bands—a range built around a moving average to show how unusually high or low prices are—are wide and expanding. The lower band is $678.80, the middle band is $781.05 and the upper band is $883.30; the price’s %B reading of 4% places it near the lower edge. The expanding 26.2% band width signals elevated volatility, so daily swings may remain large even if the stock attempts to rebound. The 14-day Average True Range (ATR), a measure of typical price movement, is $29.79, or 4.3% of the share price. Volume was 3,017,200 shares, about 1.1 times its 20-day average of 2,646,725. That above-average activity shows the decline drew more participation than a typical session. On-balance volume (OBV), which uses trading volume to track buying and selling pressure, is falling as well. Declining OBV does not support the case that buyers are quietly absorbing the sell-off. The immediate levels are the $687.00 20-day support and the $678.80 lower Bollinger Band, with the three-month low at $681.23 also close by. A sustained hold around this cluster could allow an oversold bounce; a break below it would put the chart on weaker footing. On the upside, $781.05 and $799.74—the 20- and 50-day averages—are significant hurdles before the $863.44 20-day resistance.Technical Verdict: HOLD (wait & see)
The technical picture supports a wait-and-see verdict, not a directional signal:- Downtrend remains intact: price is below the falling SMA20 and below the SMA50.
- Momentum is still negative: MACD and falling OBV point to continued selling pressure, despite oversold RSI and Stochastic readings.
- Volatility is elevated: expanding Bollinger Bands and an ATR equal to 4.3% of the price raise the risk of sharp moves around support.
- Ideal entry range: $678.80–$687.00, the lower Bollinger Band and 20-day support zone.
- Exit target: $781.05, the SMA20.
- Stop-loss protection: below $678.80, the lower Bollinger Band.
Market data: exchange data via Yahoo Finance, as of October 24, 2026, 03:00 WIB.
Why CAT is in focus today
- Closed at a 20-day low (687.00)
- Trading near its 3-month low (681.23)
- RSI(14) at 26.7 — oversold zone
- Downtrend extending (5-day change -5.99%)
Selected automatically from 30 NYSE (US) stocks by a technical-signal score with daily weighted randomisation — not a recommendation.
Summary Data CAT
| Last price | 687.00 USD |
| Change 1 day / 5 days / 1 month | -2.42% / -5.99% / -16.38% |
| Trend / MA-cross | downtrend / none |
| SMA20 / SMA50 | 781.05 / 799.74 |
| RSI (14) / Stochastic %K | 26.7 / 2.9 |
| Bollinger %B / ATR | 4% / 29.79 |
| Support / Resistance 20 days | 687.00 / 863.44 |
| Data as of | 24 October 2026 03:00 WIB |
Disclaimer: This technical analysis is generated automatically from exchange data (via Yahoo Finance) and indicators calculated by JournalArta, for information and education only. The verdict and the entry, target and stop-loss levels are not investment advice or a solicitation to buy or sell any security. Investment decisions and their risks rest solely with the reader.
Track CAT stock price daily: live levels, support/resistance and our full CAT analysis history.