CRWD Momentum Weakens: Stock Gains 8.25% (October 23, 2026)
On October 23, 2026: price 257.57 USD, trend sideways, RSI 56.1, support 227.37, resistance 278.86. technical analysis of crwd stock. CRWD Momentum Weakens —…
Trend & Price Action
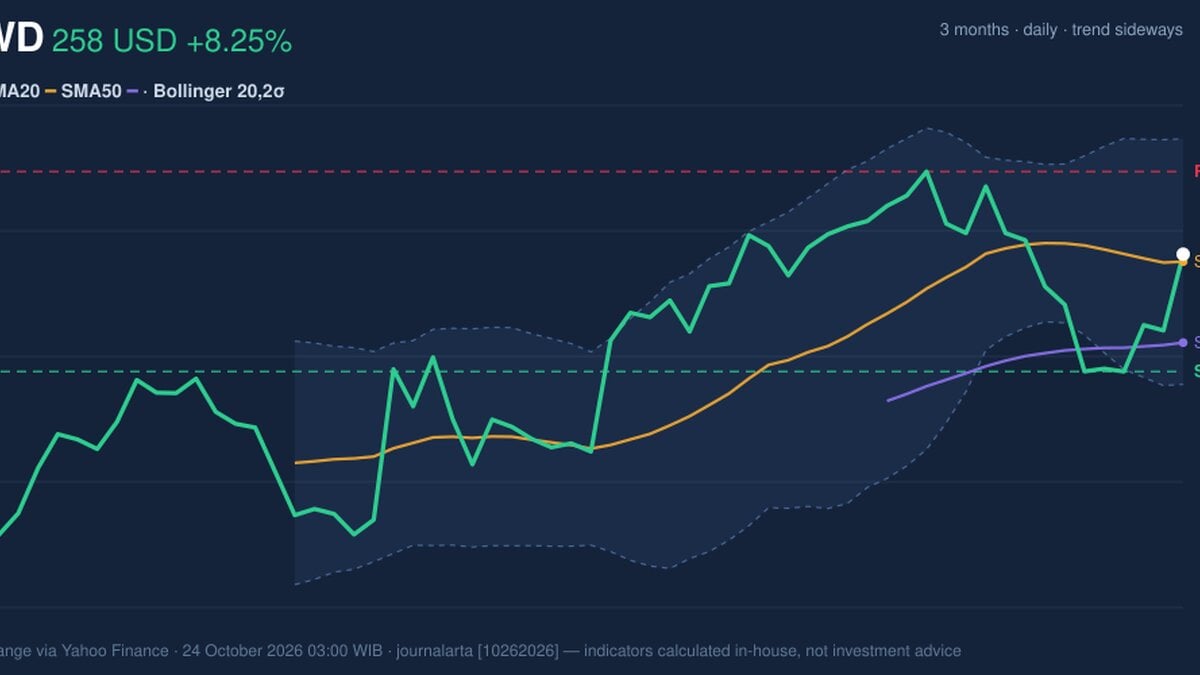
The latest close was above the 20-day simple moving average (SMA) of $255.68 and the 50-day SMA of $234.80. That positioning shows near-term price strength and a wider cushion above the longer average. But the broader trend remains sideways, and the 20-day average is sloping down by 1.60% over five trading days. There has been no new moving-average crossover, so the latest surge has not yet changed the underlying trend structure. The day’s 8.25% gain was about 1.6 times the average daily range implied by the average true range (ATR), a measure of typical price movement. That scale of move can signal renewed demand, but it also means day-to-day swings are large. The stock is 59% of the way through its 20-day support-to-resistance range, closer to resistance at $278.86 than to support at $227.37. Price is above both moving averages, but the sideways trend and falling short-term average leave the rally awaiting confirmation.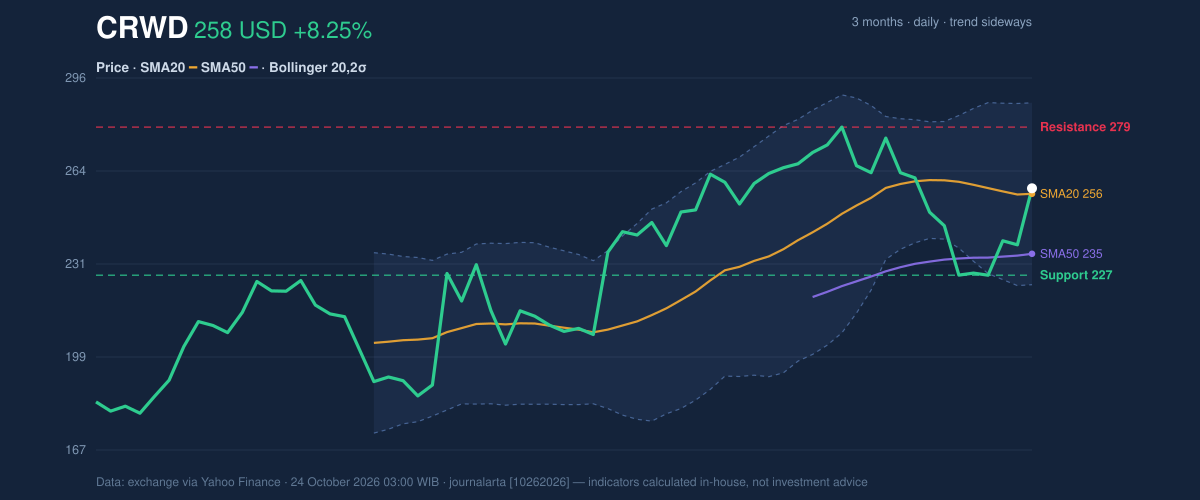
Oscillators & Momentum
The relative strength index (RSI), which gauges the pace of recent gains and losses, stood at 56.1, a neutral reading rather than an overbought signal. The stochastic oscillator was also neutral, with %K at 55.2 and %D at 35.9. The gap between the two lines suggests improving short-term momentum, although it has not produced a decisive confirmation. MACD tells a more cautious story. Its reading was 0.065 against a signal line of 3.251, leaving the histogram at -3.186, indicating negative momentum. In plain terms, the recent price rise has not yet translated into a stronger underlying momentum reading. That divergence matters: a price jump is more convincing when momentum measures rise alongside it.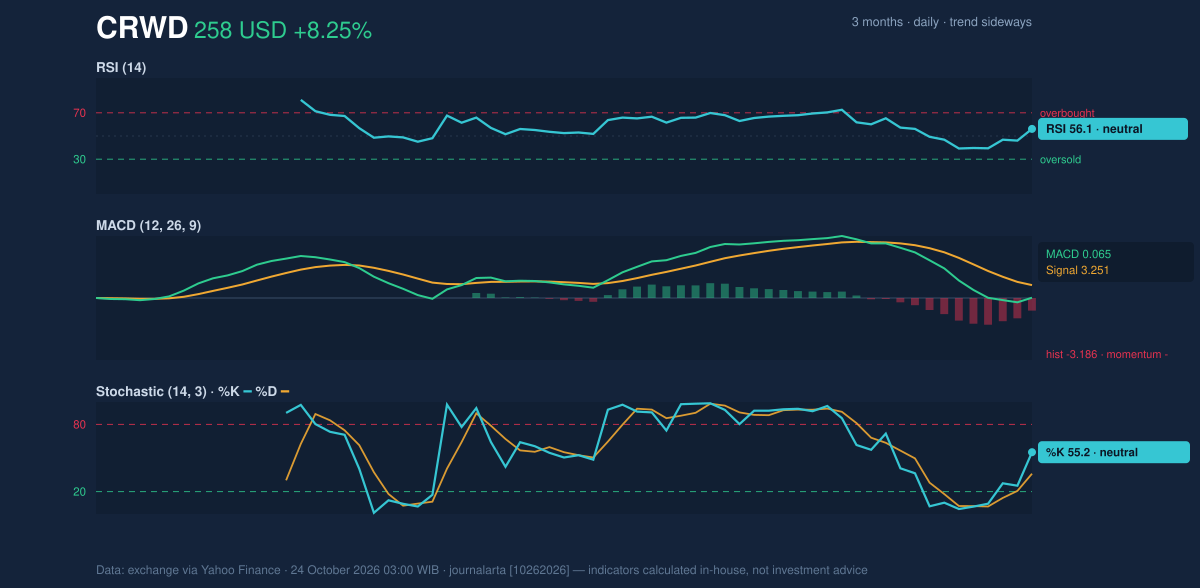
Volatility, Volume & Key Levels
CrowdStrike traded above the Bollinger-band midpoint of $255.68, with %B at 53%, placing it slightly above the center of its recent price envelope. The bands were wide, with a 24.7% width, consistent with elevated volatility rather than a quiet consolidation. The upper band at $287.32 is near the three-month high of $286.99, making that zone a notable test if the advance continues. Volume reached 13,367,500 shares, compared with a 20-day average of 8,614,995. The increase supports the view that the move drew substantial market participation. Yet on-balance volume (OBV), which tracks whether volume is more associated with rising or falling sessions, was declining. That mismatch is a warning that buying pressure may not be as consistent as the headline volume suggests. Resistance at $278.86 is the nearer test; support at $227.37 is the key level if the rally loses ground. A sustained move above resistance would put attention on the upper Bollinger band and three-month high, both around $287. A failure to hold above the 20-day average would weaken the immediate recovery, while a drop below $227.37 would break the stated 20-day support.Technical Verdict: HOLD (wait & see)
The indicators point to a rebound, not yet a confirmed trend change. The verdict reflects three signals: price has reclaimed the $255.68 SMA20 and sits above the $234.80 SMA50; RSI and stochastic remain neutral rather than stretched; and the negative MACD histogram, alongside falling OBV, leaves momentum confirmation incomplete. The verdict is invalidated if the price falls below $227.37. - Ideal entry range: $255.68–$257.57, around the SMA20 and latest close. - Exit target: $278.86, the stated 20-day resistance. - Stop-loss protection: $227.37, the stated 20-day support. For non-traders, the signals show a strong bounce, but not enough confirmation yet to establish that the stock has shifted into a lasting uptrend.Market data: exchange data via Yahoo Finance, as of October 24, 2026, 03:00 WIB.
Why CRWD is in focus today
- One-day move of 8.25%, about 1.6× its average daily range (ATR)
- Volume at 1.6× the 20-day average
- Not covered by JournalArta in the last 14 days
Selected automatically from 32 NASDAQ (US) stocks by a technical-signal score with daily weighted randomisation — not a recommendation.
Summary Data CRWD
| Last price | 257.57 USD |
| Change 1 day / 5 days / 1 month | 8.25% / 13.27% / 2.16% |
| Trend / MA-cross | sideways / none |
| SMA20 / SMA50 | 255.68 / 234.80 |
| RSI (14) / Stochastic %K | 56.1 / 55.2 |
| Bollinger %B / ATR | 53% / 13.59 |
| Support / Resistance 20 days | 227.37 / 278.86 |
| Data as of | 24 October 2026 03:00 WIB |
Disclaimer: This technical analysis is generated automatically from exchange data (via Yahoo Finance) and indicators calculated by JournalArta, for information and education only. The verdict and the entry, target and stop-loss levels are not investment advice or a solicitation to buy or sell any security. Investment decisions and their risks rest solely with the reader.
Track CRWD stock price daily: live levels, support/resistance and our full CRWD analysis history.