On October 23, 2026: price 343.39 USD, trend sideways, RSI 64.2, support 268.03, resistance 354.90. technical analysis of intu stock. Momentum Gains — full…
By Elena Vance
October 26, 20264 min read
Momentum Gains, INTU Stock Drops 3.24% on Friday
Intuit shares fell 3.24% to $343.39 on October 23, after a 24.51% rise over the past month left the stock near the upper end of its recent trading range. The pullback came as trading volume ran below its 20-day average, while momentum indicators remained positive—a mix that points to a short-term pause, not a confirmed reversal.
Trend & Price Action
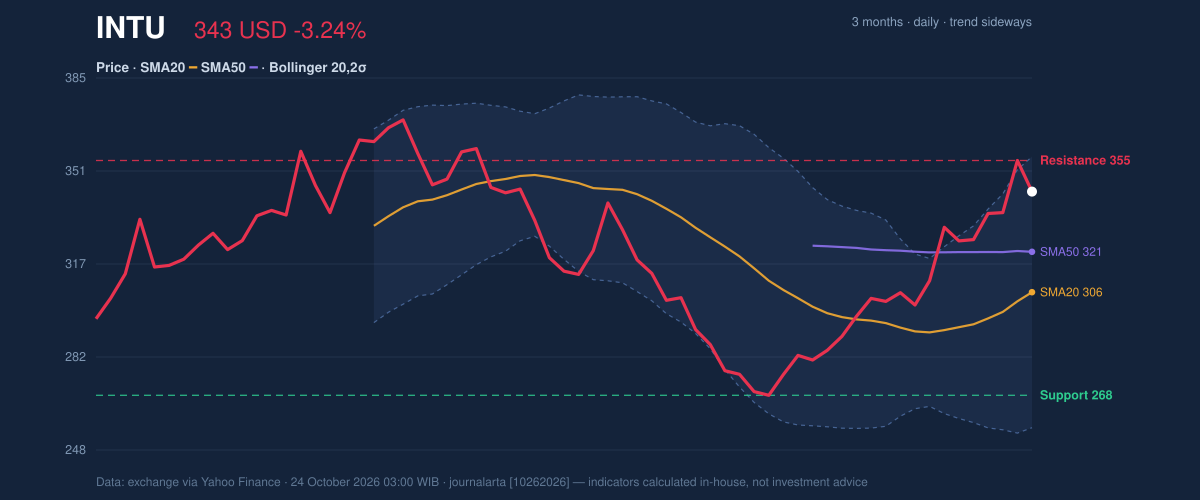
The latest decline followed a 5.61% gain over five trading days, and the share price remains above both its 20-day simple moving average (SMA) of $306.17 and 50-day SMA of $321.12. A simple moving average tracks the average closing price over a set period; trading above these levels generally indicates that the recent price structure remains firm. The 20-day average is also rising, up 4.41% over five days, although no new crossover between the two averages has formed.
The broader trend is classified as sideways, so the rising short-term average and recent monthly advance have not yet established a durable new trend. Intuit is trading at 87% of its 20-day range, with resistance at $354.90 and support at $268.03. Its three-month high and low are $372.98 and $262.32, respectively. The price’s proximity to resistance means further gains may meet selling pressure; a move above that level would be a stronger sign that buyers are extending the advance.
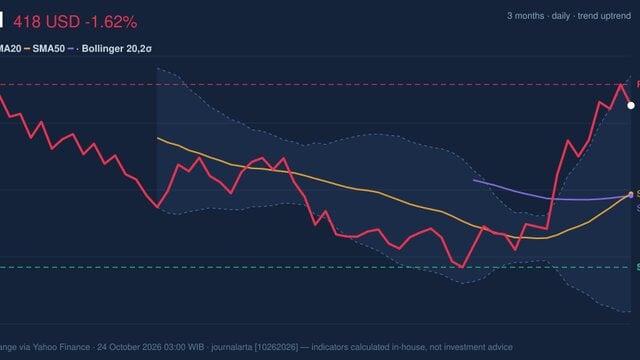
As shown in the chart, the price is above its moving averages but close to the upper Bollinger Band, a volatility measure that frames price action around an average.
3-month price action chart of INTU: price, SMA20/50, Bollinger, support & resistance. Data: exchange via Yahoo Finance.
Oscillators & Momentum
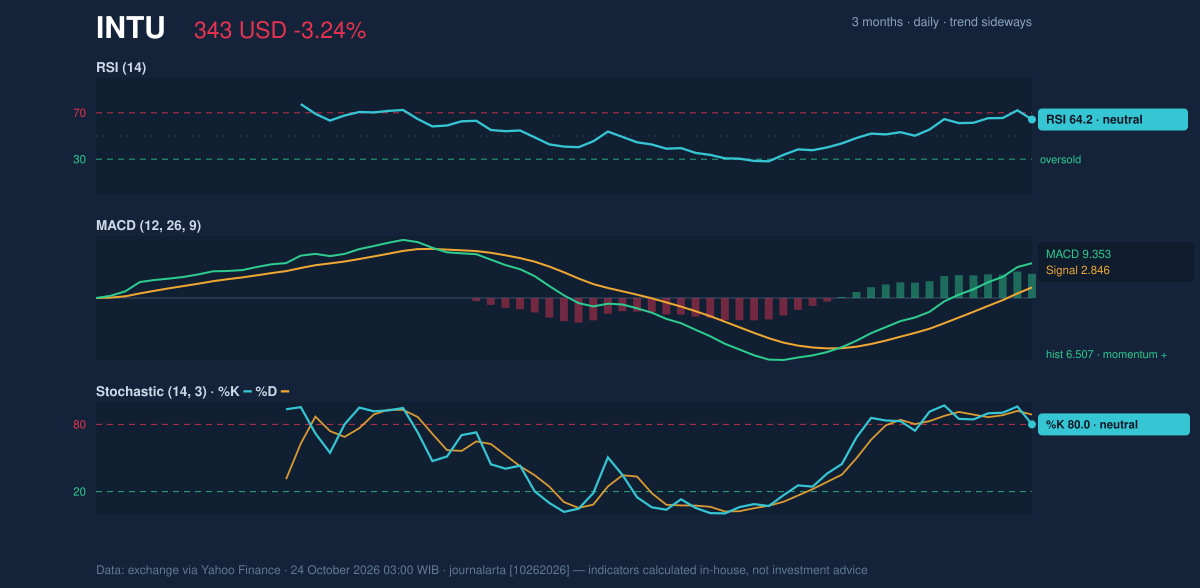
The momentum picture is constructive, though not uniformly strong. The RSI is 64.2, in neutral territory. The Relative Strength Index measures the pace of recent gains and losses; this reading signals positive momentum without reaching the conventional overbought threshold. The Stochastic readings are also classified as neutral, with %K at 80.0 and %D at 88.8. The indicator compares a closing price with its recent range, and these elevated readings suggest the price has been strong relative to that range, but do not alone confirm a reversal.
The MACD remains positive: its reading of 9.353 is above the 2.846 signal line, leaving a positive histogram of 6.507. MACD compares shorter- and longer-term price trends, so the spread indicates that upward momentum still has the upper hand. Together, the indicators show that the daily drop has not yet erased the broader momentum signal.
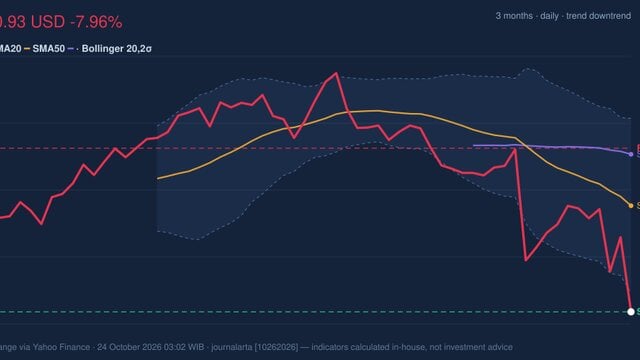
Momentum chart of INTU: RSI(14), MACD, Stochastic. Data: exchange via Yahoo Finance.
Volatility & Volume
The Bollinger Bands are widening, with a band width of 32.7%, a sign that price swings have become larger. The latest price sits at 87% of the band’s range, near the upper band at $356.30. That location is consistent with recent strength, but the expanding bands and an ATR of $12.62, or 3.7% of the share price, also point to substantial day-to-day movement. ATR estimates the typical trading range; it is not a forecast of direction.
Volume was 2,533,600 shares, or 0.7 times the 20-day average of 3,478,225. That lighter turnover makes the pullback less conclusive as evidence of broad selling pressure. Meanwhile, rising OBV—the cumulative measure of volume on up and down days—suggests buying participation has improved over time, though the latest session’s below-average activity tempers that signal.
Key Levels & Scenarios
Resistance at $354.90 is the immediate test; a sustained break above it would put the three-month high of $372.98 back in focus. Failure to clear resistance, particularly alongside weakening MACD momentum, would leave the stock vulnerable to a retreat toward its moving averages. The 50-day SMA at $321.12 is the nearer trend reference, while the 20-day SMA at $306.17 is a deeper support marker. The broader 20-day support is $268.03.
Technical Verdict: HOLD
The technical balance supports HOLD (wait & see), rather than a directional call: the price remains above its SMAs, MACD is positive, and OBV is rising, but the sideways trend, upper-band position and elevated volatility argue for caution. The verdict is invalidated if the price falls below $321.12, the 50-day SMA.
Ideal entry range: $321.12–$306.17, around the 50-day and 20-day SMAs.
Exit target: $354.90–$372.98, spanning resistance and the three-month high.
Stop-loss protection: Below $306.17, using the 20-day SMA as the reference level.
For non-traders, the indicators show a still-positive underlying structure, but the shares are close to resistance and capable of sharp moves.
Source: Exchange data via Yahoo Finance, as of October 24, 2026, 03:00 WIB. Technical analysis is not an investment recommendation.
Summary Data INTU
Last price
343.39 USD
Change 1 day / 5 days / 1 month
-3.24% / 5.61% / 24.51%
Trend / MA-cross
sideways / none
SMA20 / SMA50
306.17 / 321.12
RSI (14) / Stochastic %K
64.2 / 80.0
Bollinger %B / ATR
87% / 12.62
Support / Resistance 20 days
268.03 / 354.90
Data as of
24 October 2026 03:00 WIB
Disclaimer: This technical analysis is generated automatically from exchange data (via Yahoo Finance) and indicators calculated by JournalArta, for information and education only. The verdict and the entry, target and stop-loss levels are not investment advice or a solicitation to buy or sell any security. Investment decisions and their risks rest solely with the reader.