On October 23, 2026: price 135.77 USD, trend sideways, RSI 59.7, support 123.73, resistance 138.83. technical analysis of pep stock. PEP Stock Drops — full…
By Elena Vance
October 26, 20265 min read
PEP Stock Drops 2.20% on Friday, Momentum Gains
PepsiCo fell 2.20% to $135.77 in the latest session, despite gains over the past five trading days and month. The drop leaves the shares above their 20-day average but below the recent closing level that marks near-term resistance, while trading activity was lighter than usual.
The mixed signals make the stock worth watching: short-term momentum remains positive, but the price is near the upper end of its recent range and close to the upper Bollinger Band. That combination points to an advance that has momentum, but limited confirmation from trading volume.
Trend & Price Action
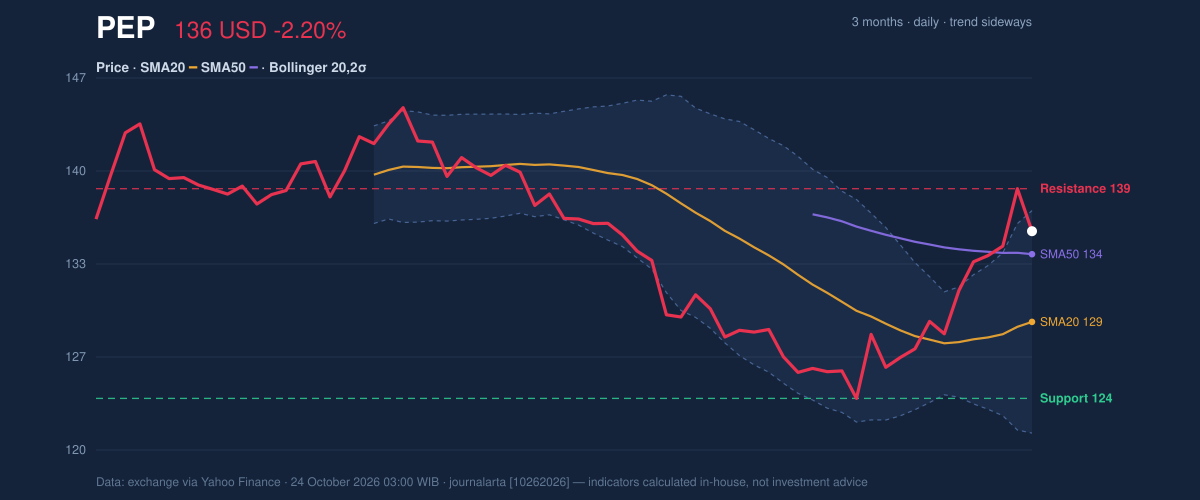
PepsiCo’s shares are up 3.25% over five trading days and 5.55% over one month, but the broader technical picture remains sideways. The stock trades at $135.77, above its 20-day simple moving average (SMA) of $129.24 and just above its 50-day SMA of $134.12. A simple moving average tracks the average closing price over a set period; being above it can indicate support from the recent trend, but does not by itself establish a sustained uptrend.
There is no new crossover between the two averages, so the price structure has not produced a fresh trend signal. The 20-day average is rising, while the share price sits at about 80% of its 20-trading-day range, closer to resistance at $138.83 than support at $123.73. That positioning matters: there is less room to the nearby ceiling than to the range floor, making a push through resistance more consequential than another small gain.
The three-month high is $145.90, and the low is $123.47. PepsiCo remains below the high, suggesting the latest rebound has not yet recovered the full ground lost from that peak.
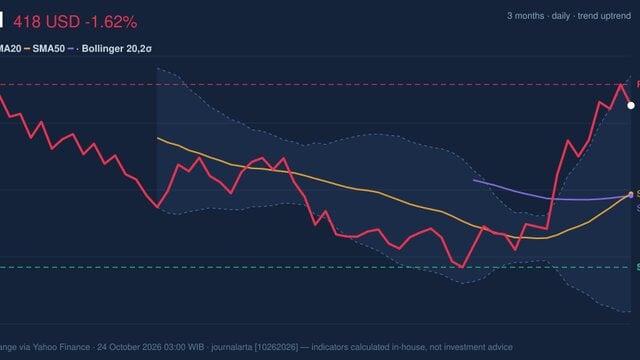
The Bollinger Bands, which frame price movements around a moving average, span $121.23 to $137.25. With the stock near the upper band and %B at 91%, price is pressing toward the top of its recent volatility envelope. The band width of 12.4% is described as normal, not unusually narrow or expanding sharply. The upper-band position signals near-term strength, but also leaves the price vulnerable to stalling if buyers cannot push through resistance.3-month price action chart of PEP: price, SMA20/50, Bollinger, support & resistance. Data: exchange via Yahoo Finance.
Oscillators & Momentum
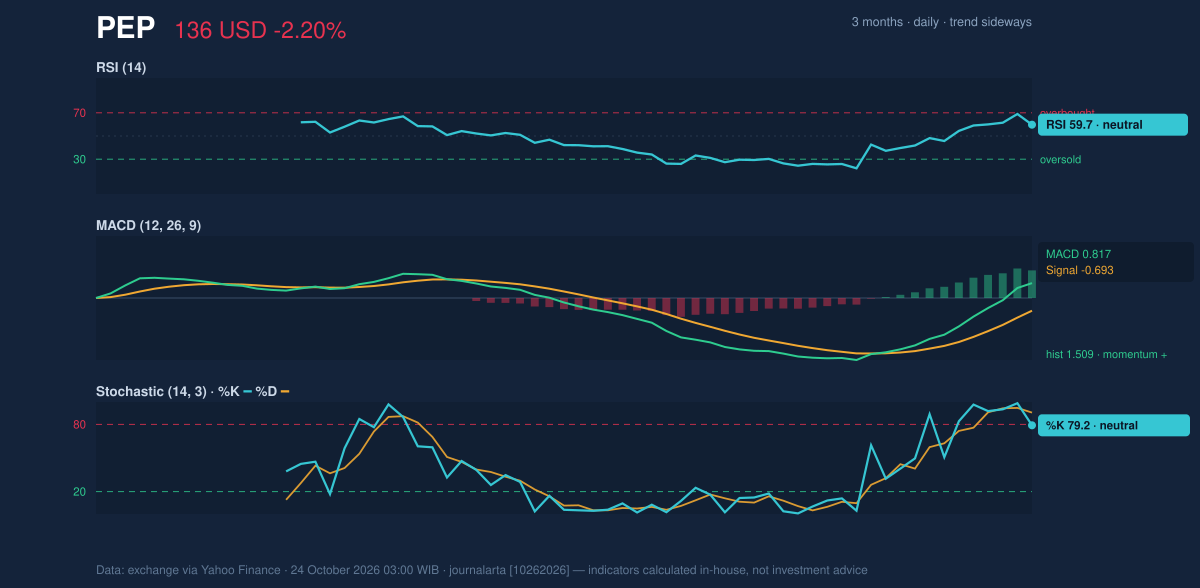
The momentum indicators are positive but not uniformly forceful. The RSI is 59.7, a neutral reading, meaning recent gains have not pushed the indicator into an extreme condition. The Stochastic readings are also classified as neutral: %K at 79.2 and %D at 90.5. Stochastic compares a closing price with its recent trading range; the gap between the two lines can signal a shift in short-term momentum, but the supplied readings do not establish a confirmed reversal.
The MACD is positive at 0.817, with a histogram of 1.509, while its signal line is -0.693. MACD compares short- and longer-term price averages to gauge momentum. The positive reading and histogram support the case that upward momentum remains in place, even as the latest daily decline shows that gains are not moving in a straight line.
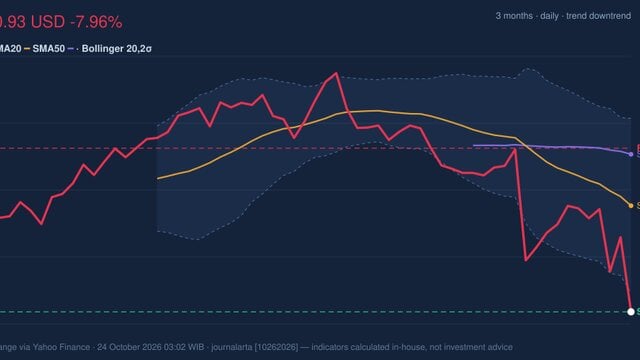
Taken together, MACD confirms upward momentum, while RSI and Stochastic remain neutral rather than providing a strong additional confirmation.Momentum chart of PEP: RSI(14), MACD, Stochastic. Data: exchange via Yahoo Finance.
Volatility, Volume & Key Levels
Average true range (ATR), a measure of typical price movement, is $3.23, or 2.4% of the share price—a moderate level of volatility. That suggests daily swings can be meaningful without the data pointing to unusually turbulent trading.
Volume was 7,475,000 shares, about 0.7 times the 20-day average of 10,175,640. The session’s decline therefore came on below-average participation. On-balance volume (OBV), which tracks whether volume tends to accompany rising or falling prices, is rising. That is a supportive sign, though the lighter turnover on the latest session weakens the evidence that the move has broad participation.
The immediate test is $138.83 resistance. A move above it would clear the recent range ceiling; failure to do so could leave the stock rotating toward support at $123.73. The 20-day average at $129.24 is an intermediate reference, while the lower Bollinger Band at $121.23 sits below the stated 20-day support. A break below $123.73 would weaken the current range structure; a break above $138.83 would provide a clearer test of whether the rebound can extend.
Technical Verdict: HOLD (wait & see)
The indicators support a neutral stance rather than a decisive directional signal:
- Reasons: Price is above both the $129.24 SMA20 and $134.12 SMA50; MACD and its histogram are positive; rising OBV offers some underlying support. Against that, the trend is sideways, volume was below its 20-day average, and the shares are near resistance and the upper Bollinger Band.
- Ideal entry range:$129.24–$134.12, bounded by the SMA20 and SMA50.
- Exit target (target price):$138.83, the 20-trading-day resistance level.
- Stop-loss protection:$123.73, the 20-trading-day support level.
- Invalidation: The HOLD verdict is invalidated if price falls below $123.73.
For non-traders, HOLD means the chart is giving mixed signals, so the next move through resistance or below support matters more than the recent daily decline.
| Indicator | Reading |
|---|---:|
| Last price | $135.77 |
| SMA20 / SMA50 | $129.24 / $134.12 |
| Resistance / support | $138.83 / $123.73 |
| RSI / Stochastic | 59.7 / %K 79.2, %D 90.5 |
| MACD / histogram | 0.817 / 1.509 |
| ATR | $3.23 (2.4%) |
PepsiCo’s latest reported session showed a 2.20% decline, with volume at 0.7 times its 20-day average.
Summary Data PEP
Last price
135.77 USD
Change 1 day / 5 days / 1 month
-2.20% / 3.25% / 5.55%
Trend / MA-cross
sideways / none
SMA20 / SMA50
129.24 / 134.12
RSI (14) / Stochastic %K
59.7 / 79.2
Bollinger %B / ATR
91% / 3.23
Support / Resistance 20 days
123.73 / 138.83
Data as of
24 October 2026 03:00 WIB
Disclaimer: This technical analysis is generated automatically from exchange data (via Yahoo Finance) and indicators calculated by JournalArta, for information and education only. The verdict and the entry, target and stop-loss levels are not investment advice or a solicitation to buy or sell any security. Investment decisions and their risks rest solely with the reader.