Momentum Gains, CapitaLand Investment Stock Drops 0.00% on Monday
On October 26, 2026: price 2.40 SGD, trend downtrend, RSI 41.9, support 2.31, resistance 2.62. technical analysis of capitaland investment stock.
Why CapitaLand Investment is in focus today
- MACD histogram has just turned positive
Selected automatically from 16 SGX (Singapore) stocks by a technical-signal score with daily weighted randomisation — not a recommendation.
Trend & Price Action
The price is below both its 20-day simple moving average, or SMA, at S$2.43 and its 50-day SMA at S$2.56. The 20-day average is falling, down 2.59% over five trading days, while no new moving-average crossover has occurred. That combination suggests the short-term trend remains weak; the recent five-day rise has not yet lifted the stock above levels that would indicate a change in direction. The share price is near the lower part of its recent trading range: it sits 29% of the way from the 20-trading-day support at S$2.31 to resistance at S$2.62. The three-month low of S$2.29 is close to that support, making the area around S$2.31–S$2.29 an important test if selling resumes. Holding above support would preserve room for a rebound, but the price needs to reclaim S$2.43 before the short-term picture improves.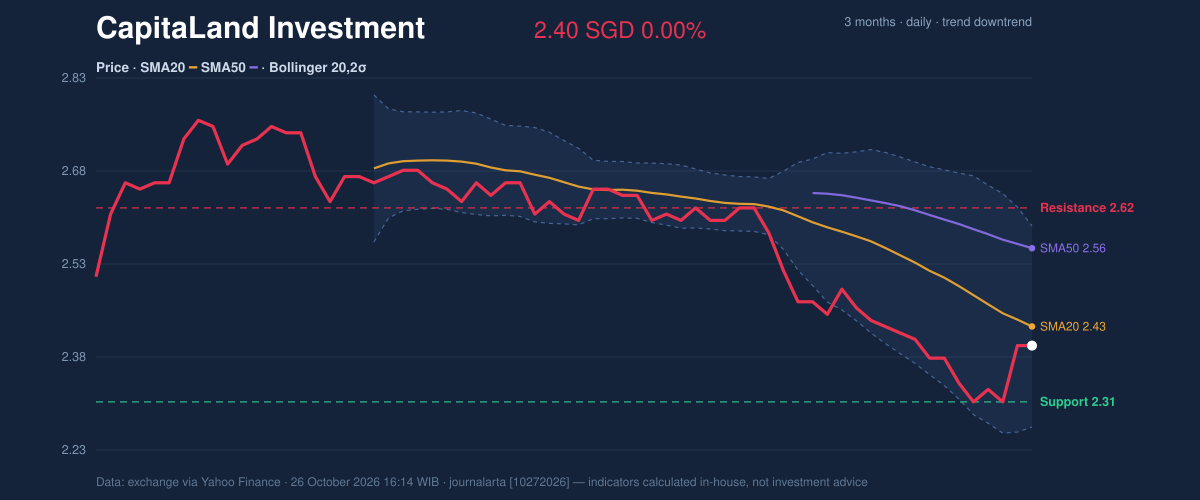
Oscillators & Momentum
The momentum readings are mixed rather than strongly bearish or bullish. RSI, a gauge of the speed of recent price moves, is 41.9, in neutral territory but below the level typically associated with stronger upward momentum. Stochastic %K at 47.8 and %D at 34.8 are also neutral, offering no clear confirmation that buyers have taken control. RSI and Stochastic remain neutral, so neither currently validates a sustained recovery. MACD provides the more constructive signal. Its histogram has edged positive at 0.002, with MACD at -0.061 just above its signal line at -0.063. A positive histogram means the gap between the two lines has shifted in a direction consistent with improving momentum; because both lines remain below zero, however, it points to a possible easing of weakness rather than an established uptrend. The MACD turn is an early improvement, not yet a trend reversal.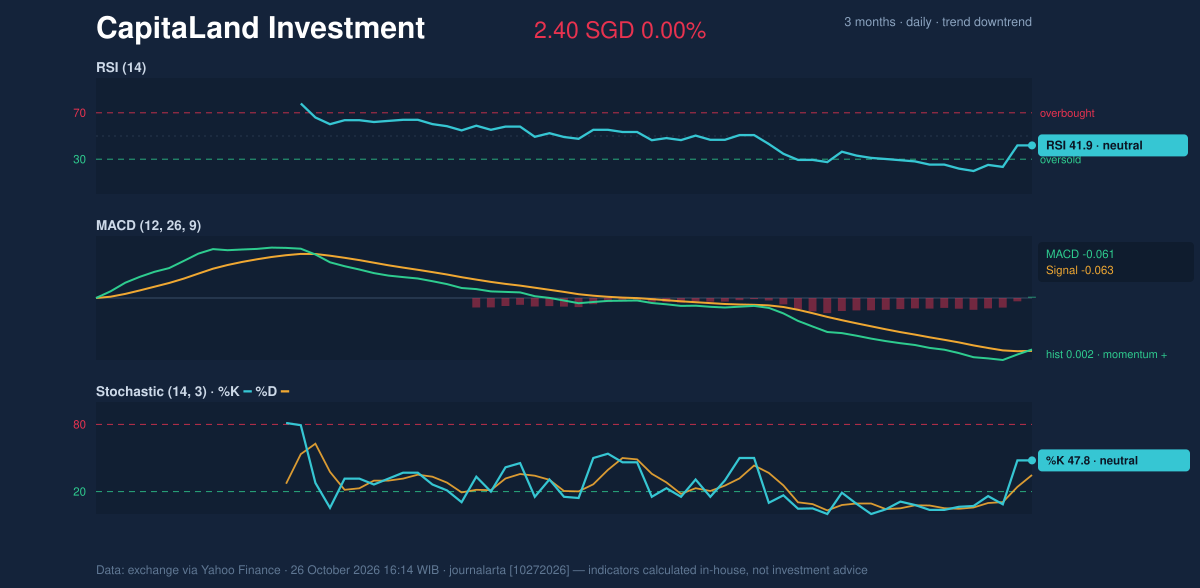
Volatility & Volume
Bollinger Bands, which show how far the price is moving from its recent average, run from S$2.27 to S$2.59, with the middle band at S$2.43. The price’s position at 41% of the band’s width is below the midpoint, consistent with lingering pressure, but not close to the lower boundary. The 13.2% band width is normal rather than unusually tight or wide, so the data do not point to a sharp volatility breakout. The Bollinger setup is neither a squeeze nor an extreme reading. Average true range, a measure of typical price movement, is S$0.05, or 2.1% of the share price, indicating moderate volatility. Participation is a concern: the latest volume of 5,718,300 was just 0.4 times the 20-day average of 13,777,015, while on-balance volume (OBV), which tracks whether trading volume is flowing more with rises or falls, is declining. Thin volume and falling OBV weaken the case that the recent bounce has broad buying support.Key Levels & Scenarios
The immediate test is whether the stock can regain the S$2.43 20-day average. A move above that level would improve the near-term structure, with S$2.56 at the 50-day average and S$2.62 resistance marking further hurdles. Failure to hold S$2.31 would expose the three-month low at S$2.29. Support at S$2.31 and resistance at S$2.62 define the current trading range.Technical Verdict: HOLD (wait & see)
The verdict reflects three signals: price remains below falling SMA20 and SMA50; the MACD histogram has turned positive but both MACD lines remain below zero; and low volume alongside falling OBV does not confirm the rebound. The verdict is invalidated if the price falls below S$2.31, the 20-trading-day support. - Ideal entry range: S$2.31–S$2.43, bounded by support and the SMA20. - Exit target: S$2.62, the 20-trading-day resistance. - Stop-loss protection: S$2.27, the lower Bollinger Band. In plain English, the indicators show an early improvement in momentum, but not enough confirmation to resolve the downtrend. Data table — CapitaLand Investment (9CI.SI), as of Oct. 26, 2026, 16:14 WIB | Indicator | Reading | |---|---:| | Last price | S$2.40 | | SMA20 / SMA50 | S$2.43 / S$2.56 | | RSI(14) | 41.9 | | Stochastic %K / %D | 47.8 / 34.8 | | MACD / signal / histogram | -0.061 / -0.063 / 0.002 | | Bollinger lower / middle / upper | S$2.27 / S$2.43 / S$2.59 | | Support / resistance | S$2.31 / S$2.62 | | ATR(14) | S$0.05 | | Latest volume / 20-day average | 5,718,300 / 13,777,015 |Summary Data CapitaLand Investment
| Last price | 2.40 SGD |
| Change 1 day / 5 days / 1 month | 0.00% / 2.56% / -8.40% |
| Trend / MA-cross | downtrend / none |
| SMA20 / SMA50 | 2.43 / 2.56 |
| RSI (14) / Stochastic %K | 41.9 / 47.8 |
| Bollinger %B / ATR | 41% / 0.05 |
| Support / Resistance 20 days | 2.31 / 2.62 |
| Data as of | 26 October 2026 16:14 WIB |
Disclaimer: This technical analysis is generated automatically from exchange data (via Yahoo Finance) and indicators calculated by JournalArta, for information and education only. The verdict and the entry, target and stop-loss levels are not investment advice or a solicitation to buy or sell any security. Investment decisions and their risks rest solely with the reader.
Track CapitaLand Investment share price daily: live levels, support/resistance and our full CapitaLand Investment analysis history.