Momentum Weakens, ICBC Stock Gains 2.76% on Monday
On October 26, 2026: price 7.44 HKD, trend sideways, RSI 46.9, support 7.24, resistance 7.71. technical analysis of icbc stock. Momentum Weakens — full details…
Trend & Price Action
At HK$7.44, the share price remains below both its 20-day simple moving average (SMA) of HK$7.54 and its 50-day SMA of HK$7.52. These averages track recent prices over different periods; trading below both suggests that the latest rebound has not yet recovered the levels that had been acting as a trend reference. The 20-day average is also slipping, down 0.56% over five days. There has been no new moving-average crossover to signal a change in trend. The stock is trading at 43% of its 20-day range, between support at HK$7.24 and resistance at HK$7.71. Its three-month range, from HK$7.09 to HK$7.77, places the current price away from both extremes. The price is below both moving averages, despite the day’s sharp gain, so confirmation would require more than a one-session rise. As shown in the chart, the price sits below the moving-average lines and within narrowing Bollinger Bands, which plot a moving average alongside upper and lower boundaries that widen or contract with volatility.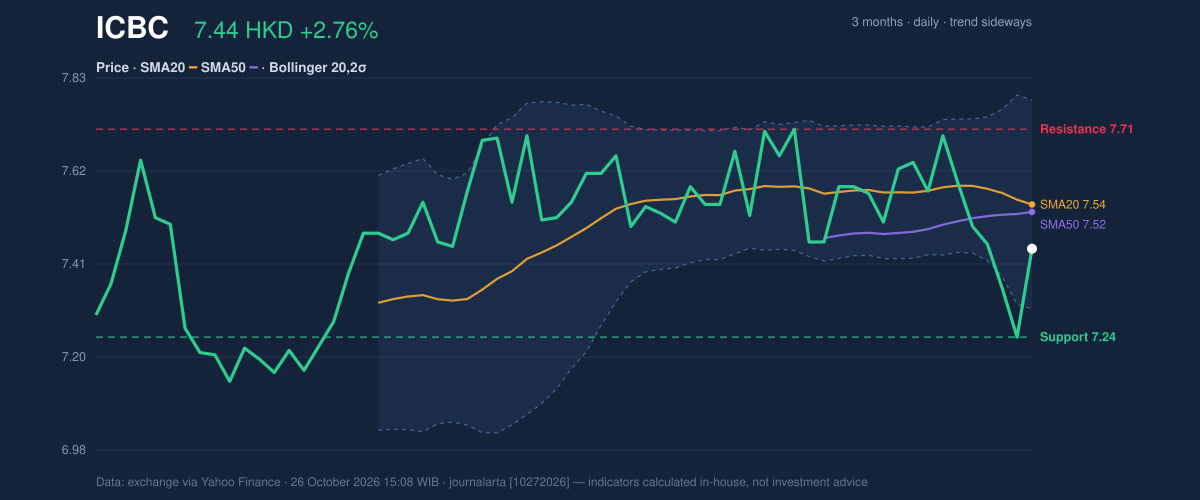
Oscillators & Momentum
The indicators give a mixed reading. The 14-day Relative Strength Index (RSI), which measures the pace of recent gains and losses, stands at 46.9, a neutral reading rather than an oversold signal. The Stochastic oscillator compares the closing price with its recent range: %K is 47.8 and %D is 25.7, also classed as neutral. Neither reading indicates that the rally is already stretched, but neither confirms a strong upward impulse. The MACD, a trend-and-momentum measure, is more cautious. Its reading is -0.036, below the signal line at -0.005, with a negative histogram of -0.031. That configuration indicates downside momentum remains in place, even after the latest gain. The gap between the day’s price action and the MACD reading is a reason to treat the rebound as tentative until momentum improves. The chart shows RSI, MACD and Stochastic together; their contrast helps distinguish a sharp daily move from a broader momentum shift.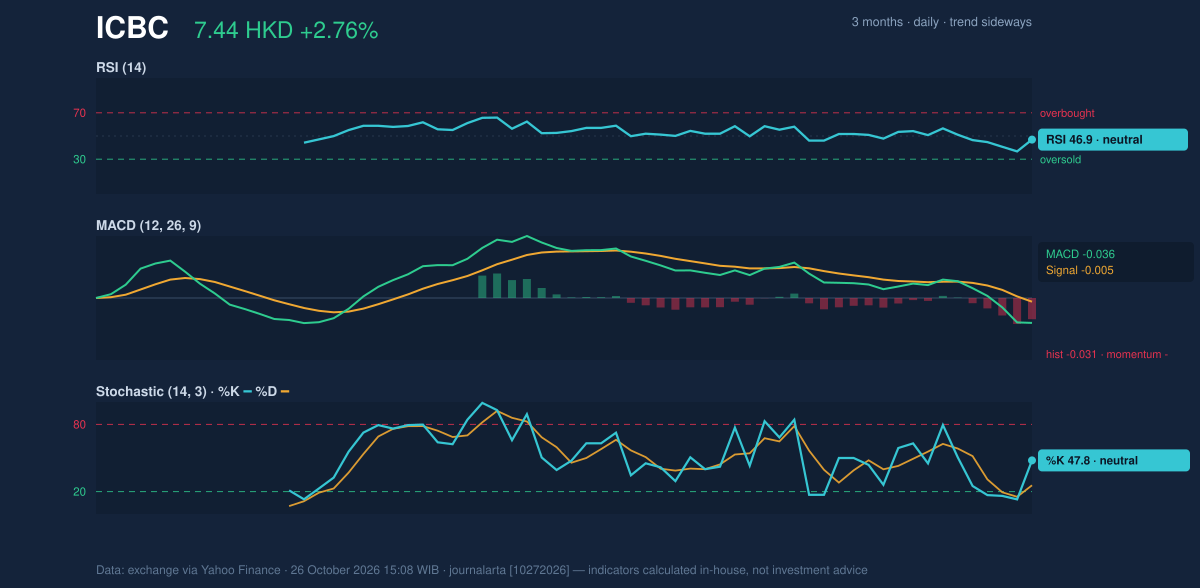
Volatility, Volume & Key Levels
The Bollinger Band width has narrowed to 6.3%, a squeeze that signals subdued recent volatility and the potential for a larger move as the range tightens. It does not predict the direction of that move. The price’s %B reading is 29%, placing it in the lower portion of the bands, while the upper, middle and lower boundaries stand at HK$7.78, HK$7.54 and HK$7.30. The squeeze points to possible expansion, not a confirmed breakout. The Average True Range (ATR), a measure of typical daily movement, is HK$0.17, or 2.3% of the share price—moderate volatility. Volume was 138,825,202 shares, about 0.8 times the 20-day average of 172,908,660. On-Balance Volume (OBV), which uses volume to track buying and selling pressure, is falling. Together, thin participation and declining OBV weaken the case that buyers have broadly confirmed the day’s advance. A close above HK$7.71 resistance would put the upper Bollinger Band at HK$7.78 and the three-month high at HK$7.77 in focus. Failure to hold HK$7.24 support would expose the lower three-month boundary at HK$7.09. Those are conditional levels, not forecasts.Technical Verdict: HOLD
The technical verdict is HOLD (wait and see): the rebound has not yet reversed the cautious signals from the trend and volume indicators. The main reasons are that the share price remains below both the SMA20 and SMA50, MACD remains negative, and volume is below its 20-day average while OBV falls. The verdict is invalidated if the price falls below HK$7.24 support. - Ideal entry range: HK$7.30–HK$7.54, bounded by the lower Bollinger Band and the SMA20; this is a technical reference range, not a recommendation. - Exit target: HK$7.71, the 20-day resistance level. - Stop-loss protection: HK$7.24, the 20-day support level. In plain English, the chart is waiting for stronger evidence that the one-day rise can overcome weak momentum and selling pressure.Data table
Why ICBC is in focus today
- One-day move of 2.76%, about 1.2× its average daily range (ATR)
Selected automatically from 16 HKEX (Hong Kong) stocks by a technical-signal score with daily weighted randomisation — not a recommendation.
| Indicator | Reading |
|---|---|
| Last price | HK$7.44 |
| Daily / five-day / one-month change | +2.76% / -1.98% / -2.87% |
| SMA20 / SMA50 | HK$7.54 / HK$7.52 |
| Bollinger upper / middle / lower | HK$7.78 / HK$7.54 / HK$7.30 |
| RSI / Stochastic %K, %D | 46.9 / 47.8, 25.7 |
| MACD / signal / histogram | -0.036 / -0.005 / -0.031 |
| ATR | HK$0.17 (2.3%) |
| Volume / 20-day average | 138,825,202 / 172,908,660 |
| Support / resistance | HK$7.24 / HK$7.71 |
| Three-month high / low | HK$7.77 / HK$7.09 |
Summary Data ICBC
| Last price | 7.44 HKD |
| Change 1 day / 5 days / 1 month | 2.76% / -1.98% / -2.87% |
| Trend / MA-cross | sideways / none |
| SMA20 / SMA50 | 7.54 / 7.52 |
| RSI (14) / Stochastic %K | 46.9 / 47.8 |
| Bollinger %B / ATR | 29% / 0.17 |
| Support / Resistance 20 days | 7.24 / 7.71 |
| Data as of | 26 October 2026 15:08 WIB |
Disclaimer: This technical analysis is generated automatically from exchange data (via Yahoo Finance) and indicators calculated by JournalArta, for information and education only. The verdict and the entry, target and stop-loss levels are not investment advice or a solicitation to buy or sell any security. Investment decisions and their risks rest solely with the reader.
Track ICBC share price daily: live levels, support/resistance and our full ICBC analysis history.