Sembcorp Stock Drops 2.83% on Monday, Testing Support Level
On October 26, 2026: price 5.84 SGD, trend sideways, RSI 43.8, support 5.79, resistance 6.08. technical analysis of sembcorp stock. Sembcorp Stock Drops — full…
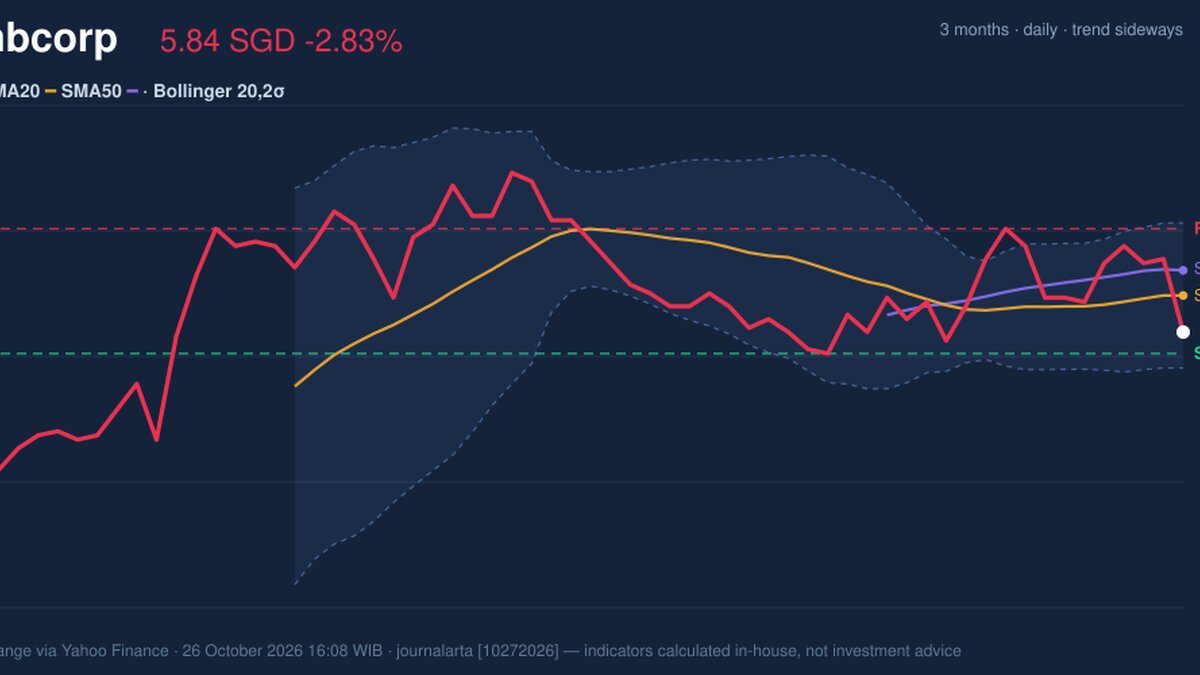
Sembcorp Industries fell 2.83% to S$5.84 on the Singapore Exchange on 26 October, with trading volume reaching twice its 20-session average as its MACD histogram turned negative. The combination makes the session notable: trading activity intensified during a decline, while the price slipped below both its 20- and 50-day moving averages. That is a warning of fading short-term momentum, though the broader price structure remains sideways rather than decisively bearish.
Why Sembcorp is in focus today
- Volume at 2.0× the 20-day average
- MACD histogram has just turned negative
Selected automatically from 16 SGX (Singapore) stocks by a technical-signal score with daily weighted randomisation — not a recommendation.
Trend & Price Action
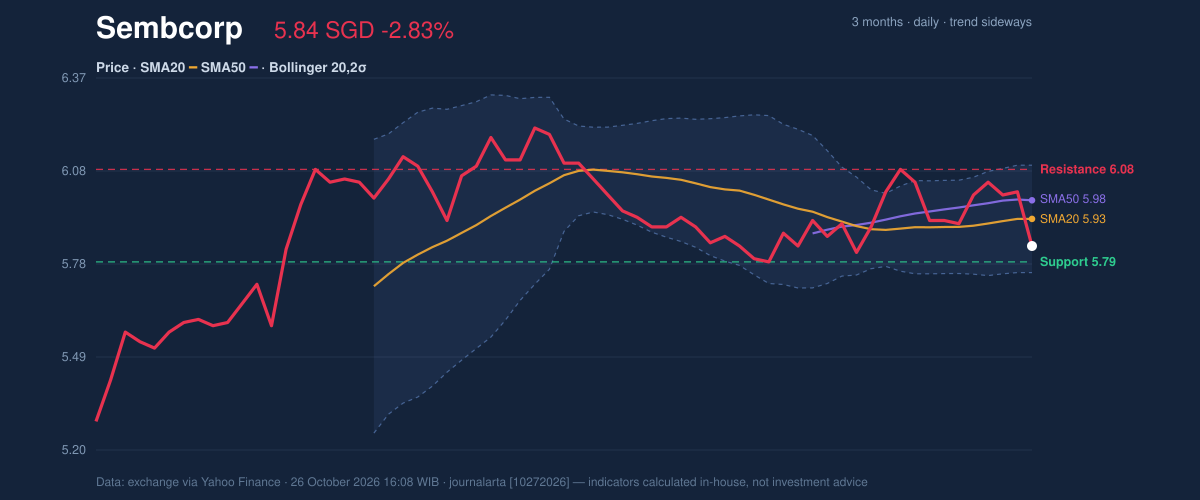
Sembcorp’s last price of S$5.84 was below its SMA20 at S$5.93 and SMA50 at S$5.98. The two averages have not crossed recently, so there is no fresh signal that the longer trend has changed direction. The SMA20 is still edging upward, but the share’s position beneath both averages suggests buyers have not yet reclaimed control of the near-term trend.
The stock is near the lower end of its 20-session range, at 17% of the distance from support to resistance. That puts the S$5.79 support level in focus: it is close enough that another weak session could test whether buyers are willing to defend the area. The three-month range, from S$5.22 to S$6.22, provides wider context, but does not by itself establish where the next move will go.
The Bollinger Bands are narrowing, with a 5.7% width, a pattern commonly called a squeeze. It signals that recent price swings have become more contained and that a stronger move may follow, but it does not predict the direction. The current 25% Bollinger %B reading places the price in the lower part of the band, consistent with pressure near support rather than an established rebound.
Oscillators & Momentum
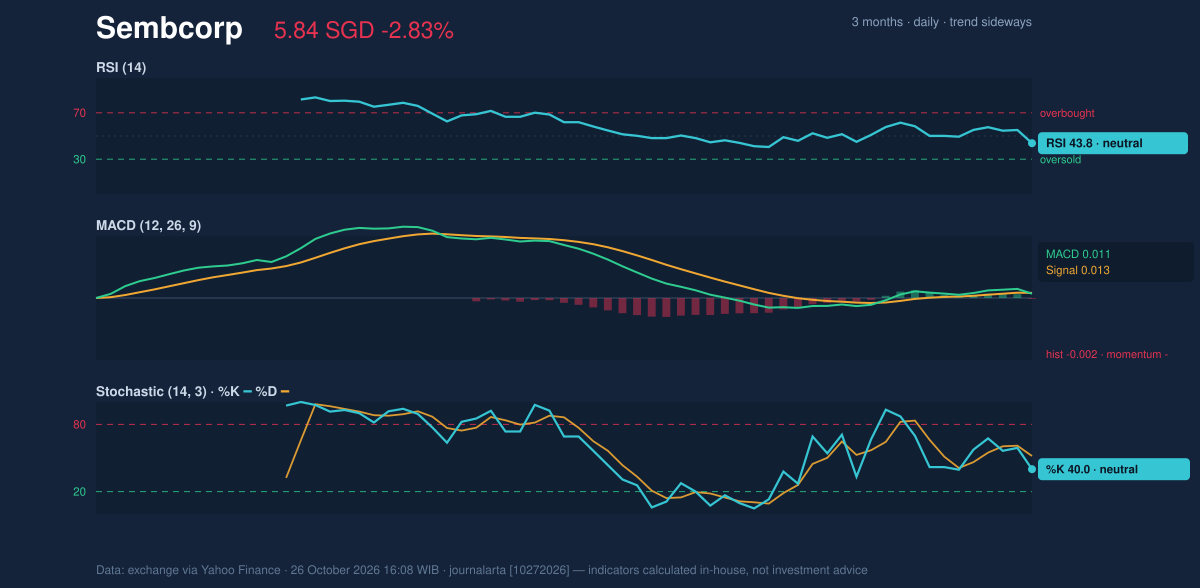
The momentum indicators are cautious, not extreme. The RSI is 43.8, a neutral reading below the midpoint that indicates weaker momentum without showing an oversold condition. The Stochastic is also neutral, with %K at 40.0 below %D at 51.8; that gap points to recent softness, but neither reading alone confirms a reversal.
More importantly, the MACD histogram has just turned negative at -0.002, with MACD at 0.011 below its 0.013 signal line. This is a modest bearish shift: it means the MACD’s short-term momentum measure has weakened relative to its signal, not that the share has entered a sustained downtrend. The change matters more because it coincided with a high-volume decline.
Volatility & Volume
Volume rose to 9,144,900 shares, around 2.0 times the 20-session average of 4,648,975. A price decline on heavier-than-usual trading suggests broader participation in the selling than a quiet retreat would. The falling OBV, or on-balance volume—a measure that adds volume on rising sessions and subtracts it on falling sessions—reinforces that caution: recent trading flow has not yet shown accumulation.
Average True Range is S$0.14, equal to 2.4% of the share price, indicating moderate daily volatility. In practical terms, moves around nearby technical levels can be meaningful without being extraordinary. The narrowing Bollinger Bands and elevated turnover therefore point in different but related ways: volatility has been compressed, while participation has picked up during the latest decline.
Key Levels & Scenarios
The immediate test is S$5.79 support, with S$6.08 resistance marking the upper boundary of the 20-session range. If the price holds above support and recovers toward resistance, the move would need confirmation from improving momentum and volume to suggest more than a short-term bounce. A break below S$5.79 would weaken the sideways structure and leave the three-month low of S$5.22 as the broader reference point.
Technical Verdict: HOLD (wait & see)
The technical picture supports a wait-and-see reading: price is below both moving averages, momentum has weakened, and the high-volume decline has not been confirmed by a turn in OBV. The opposing consideration is that RSI and Stochastic remain neutral, while the sideways trend and narrowing bands leave room for a move in either direction. This verdict is invalidated if the price falls below S$5.79 support.
- Ideal entry range: S$5.79–S$5.93, bounded by 20-session support and the SMA20.
- Exit target: S$6.08, the 20-session resistance level.
- Stop-loss protection: S$5.76, the lower Bollinger Band.
In plain English, the share has not yet shown enough evidence of a durable recovery, and the nearby support level is the key test.
Market data: exchange data via Yahoo Finance, as of 26 October 2026, 16:08 WIB.
Summary Data Sembcorp
| Last price | 5.84 SGD |
| Change 1 day / 5 days / 1 month | -2.83% / -1.18% / 0.00% |
| Trend / MA-cross | sideways / none |
| SMA20 / SMA50 | 5.93 / 5.98 |
| RSI (14) / Stochastic %K | 43.8 / 40.0 |
| Bollinger %B / ATR | 25% / 0.14 |
| Support / Resistance 20 days | 5.79 / 6.08 |
| Data as of | 26 October 2026 16:08 WIB |
Disclaimer: This technical analysis is generated automatically from exchange data (via Yahoo Finance) and indicators calculated by JournalArta, for information and education only. The verdict and the entry, target and stop-loss levels are not investment advice or a solicitation to buy or sell any security. Investment decisions and their risks rest solely with the reader.
Track Sembcorp share price daily: live levels, support/resistance and our full Sembcorp analysis history.