NetEase Stock Technicals: Gains 1.04% on Monday, Golden Cross Formed
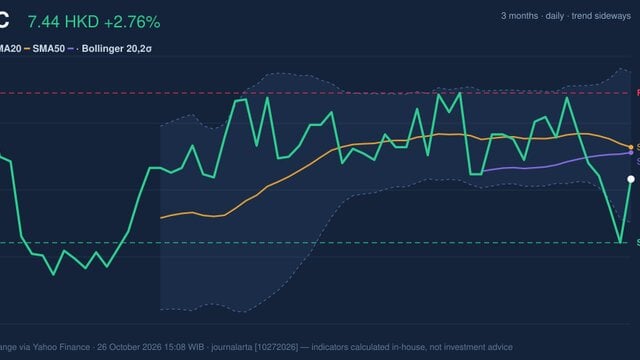
On October 26, 2026: price 184.90 HKD, trend sideways, RSI 44.0, support 180.90, resistance 199.10. technical analysis of netease stock.
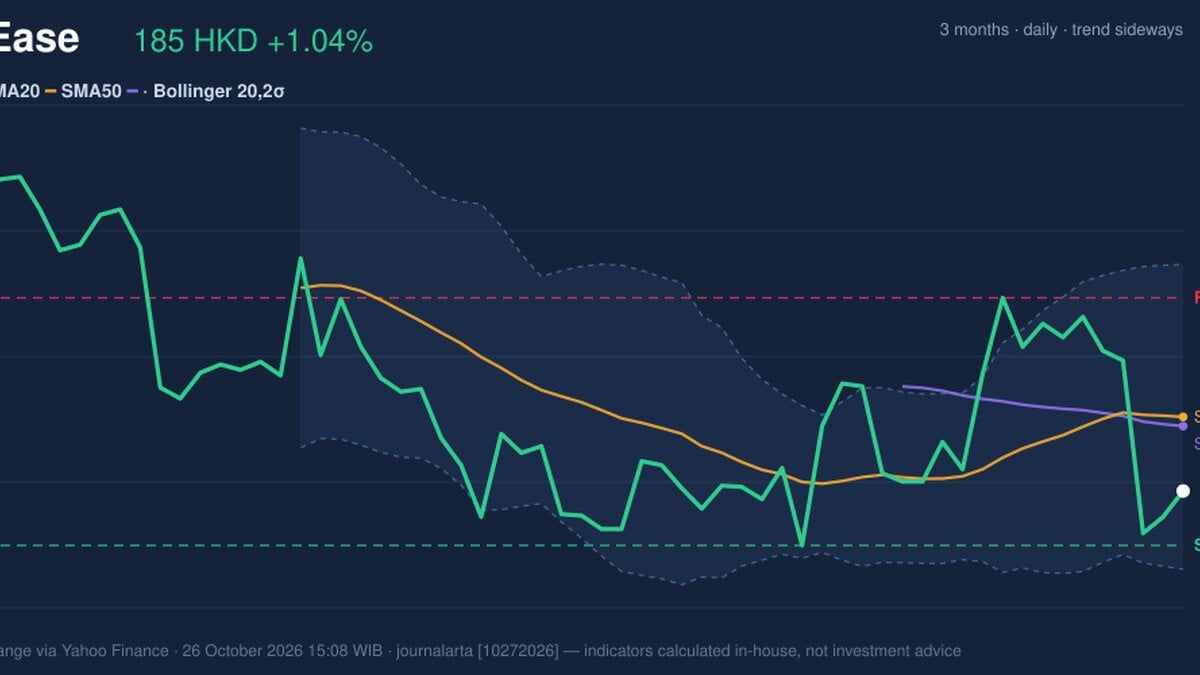
Why NetEase is in focus today
- Fresh golden cross: SMA20 crossed above SMA50
Selected automatically from 16 HKEX (Hong Kong) stocks by a technical-signal score with daily weighted randomisation — not a recommendation.
Trend & Price Action
NetEase rose 1.04% on the day, recovering some ground after falling 6.47% over five days. The one-month change was a smaller decline of 0.91%, consistent with a broadly sideways trend. At HKD 184.90, the price remains below the SMA20 at HKD 190.35 and the SMA50 at HKD 189.67. In plain terms, the golden cross is a constructive signal from the averages, but buyers have not yet pushed the share price back above them. That distinction matters. A moving-average crossover is based on past prices and can lag a reversal; it becomes more persuasive if the price also regains the averages and holds there. The SMA20’s 0.38% rise over five days suggests its slope is modestly positive, rather than a steep acceleration. As shown in the chart, the shares are near the lower portion of the 20-trading-day range: the 20-day support is HKD 180.90 and resistance is HKD 199.10, with the price about 22% of the way up that range. The three-month low of HKD 179.00 is close to support, while the high was HKD 210.60. The nearby floor is therefore a key test.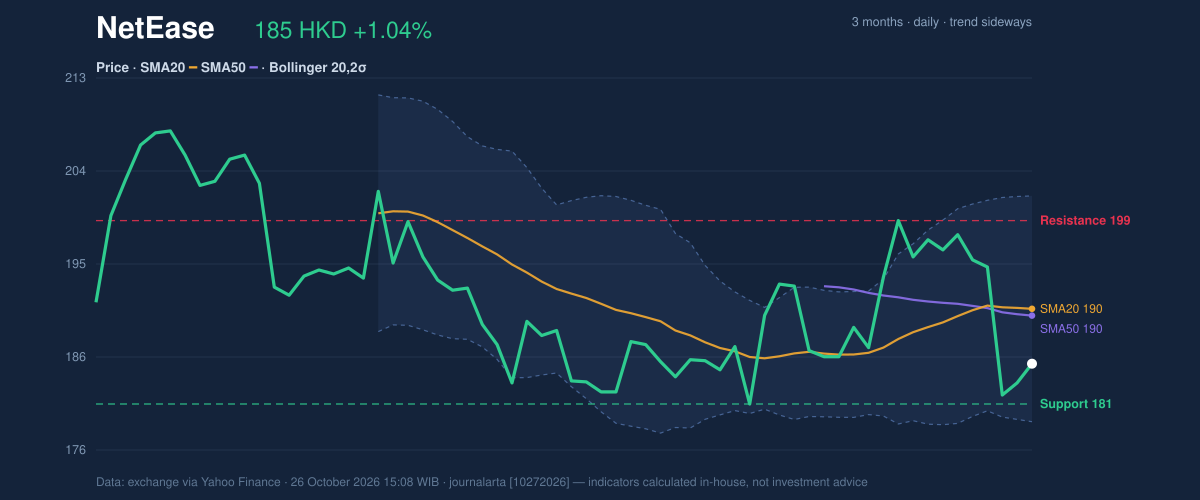
Oscillators & Momentum
The momentum indicators do not yet confirm the crossover. RSI is 44.0, a neutral reading: it points to neither unusually strong buying nor an extreme sell-off. The Stochastic readings—%K at 20.3 and %D at 12.4, both classified as neutral—are near the lower end of their scale, but do not by themselves establish a reversal. MACD is the weaker signal. MACD is -0.264, below its 0.756 signal line, with a -1.020 histogram. The histogram measures the gap between MACD and its signal line; a negative reading here indicates that downward momentum is still present. That does not negate the golden cross, but it shows why the price has not yet reclaimed the moving averages.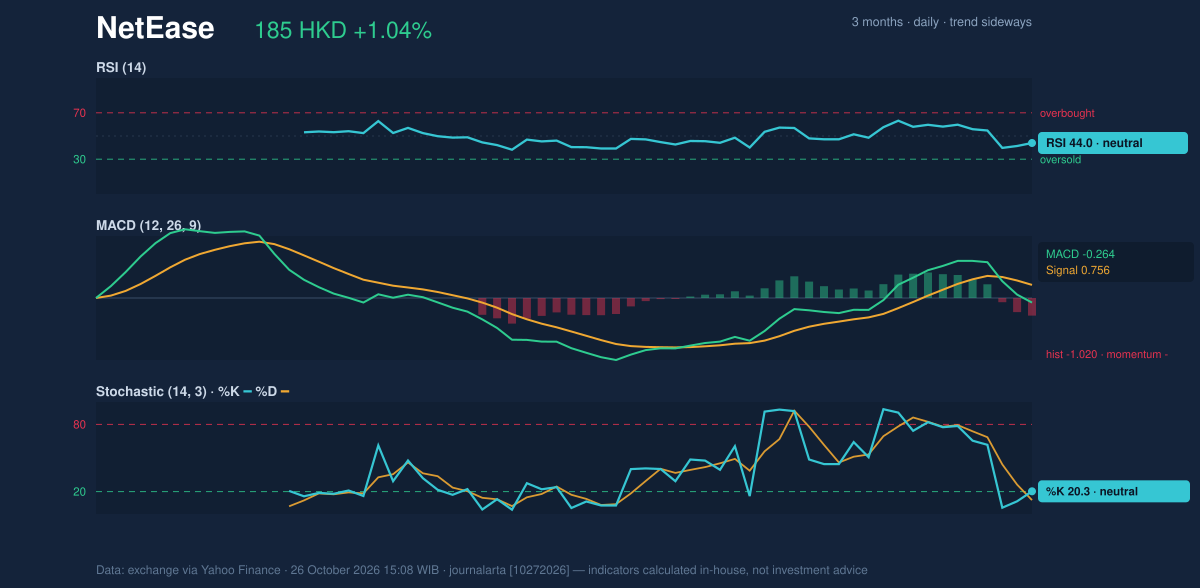
Volatility, Volume & Key Levels
The Bollinger Bands put the price in the lower half of its recent range. The %B reading is 26%, meaning the share price is closer to the lower band than the upper band; the bands themselves have a normal width of 11.8%, not a squeeze that would signal unusually compressed volatility. The lower band at HKD 179.15 sits close to the three-month low and just below 20-day support, concentrating attention on the HKD 179.00–180.90 area. Average true range, a measure of typical daily price movement, is HKD 6.46, or 3.5% of the share price—moderate volatility. Volume was 6,870,089 shares, about 1.1 times the 20-day average, while on-balance volume (OBV), which tracks whether volume accompanies rising or falling prices, was rising. That hints at some accumulation, but one above-average session does not outweigh the negative MACD or prove sustained demand. A hold above HKD 180.90, particularly with a move back above the SMA50 and SMA20, would strengthen the case that the crossover is gaining traction. A break below support would instead put the lower Bollinger Band and three-month low in focus. Resistance at HKD 199.10 is the next notable ceiling in the 20-day range.Technical Verdict: HOLD
Core verdict: HOLD (wait & see), as the golden cross and rising OBV are constructive, but the price remains below both moving averages and MACD momentum is negative. - Ideal entry range: HKD 180.90–190.35, bounded by 20-day support and the SMA20; this is a technical reference range, not a recommendation. - Exit target: HKD 199.10, the 20-day resistance. - Stop-loss protection: HKD 179.00, the three-month low and just below the lower Bollinger Band. - Invalidation: the verdict is invalidated if the price falls below HKD 179.00. For non-traders, the signals are mixed: the trend may be improving, but the price has not yet confirmed it.Summary Data NetEase
| Last price | 184.90 HKD |
| Change 1 day / 5 days / 1 month | 1.04% / -6.47% / -0.91% |
| Trend / MA-cross | sideways / golden |
| SMA20 / SMA50 | 190.35 / 189.67 |
| RSI (14) / Stochastic %K | 44.0 / 20.3 |
| Bollinger %B / ATR | 26% / 6.46 |
| Support / Resistance 20 days | 180.90 / 199.10 |
| Data as of | 26 October 2026 15:08 WIB |
Disclaimer: This technical analysis is generated automatically from exchange data (via Yahoo Finance) and indicators calculated by JournalArta, for information and education only. The verdict and the entry, target and stop-loss levels are not investment advice or a solicitation to buy or sell any security. Investment decisions and their risks rest solely with the reader.
Track NetEase share price daily: live levels, support/resistance and our full NetEase analysis history.