AstraZeneca Stock Analysis: Drops 0.25%, Testing Key Resistance
On October 27, 2026: price 12,822.00 GBp, trend uptrend, RSI 59.5, support 11,764.00, resistance 12,980.00. technical analysis of astrazeneca stock.
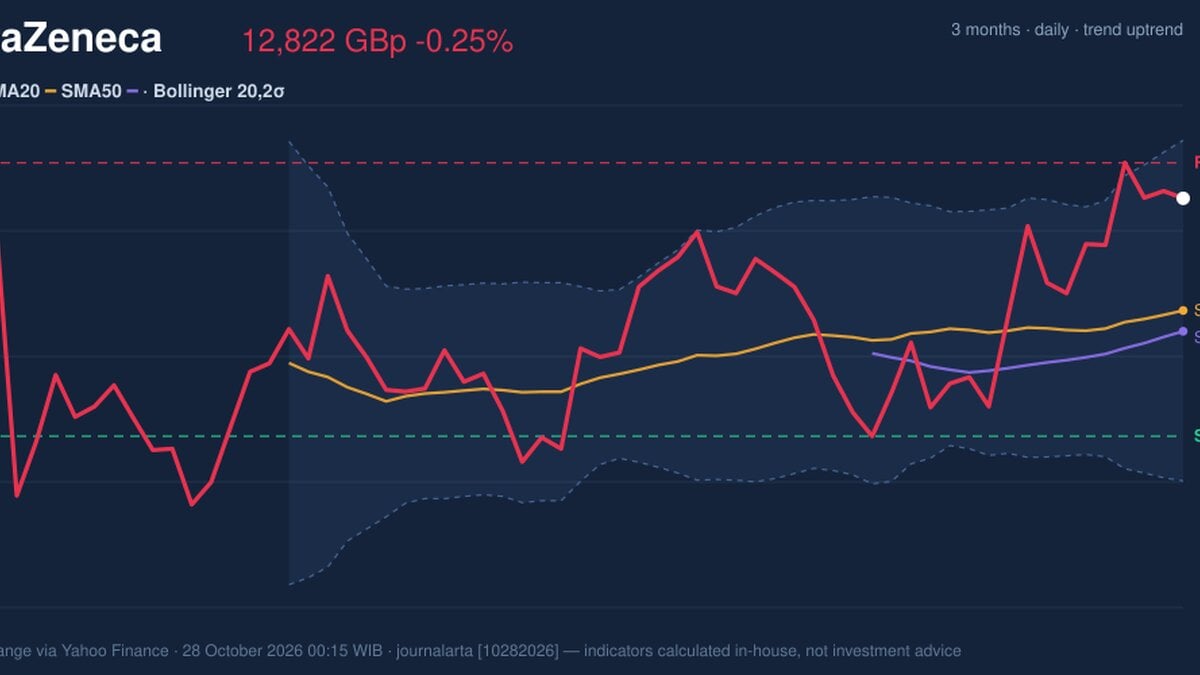
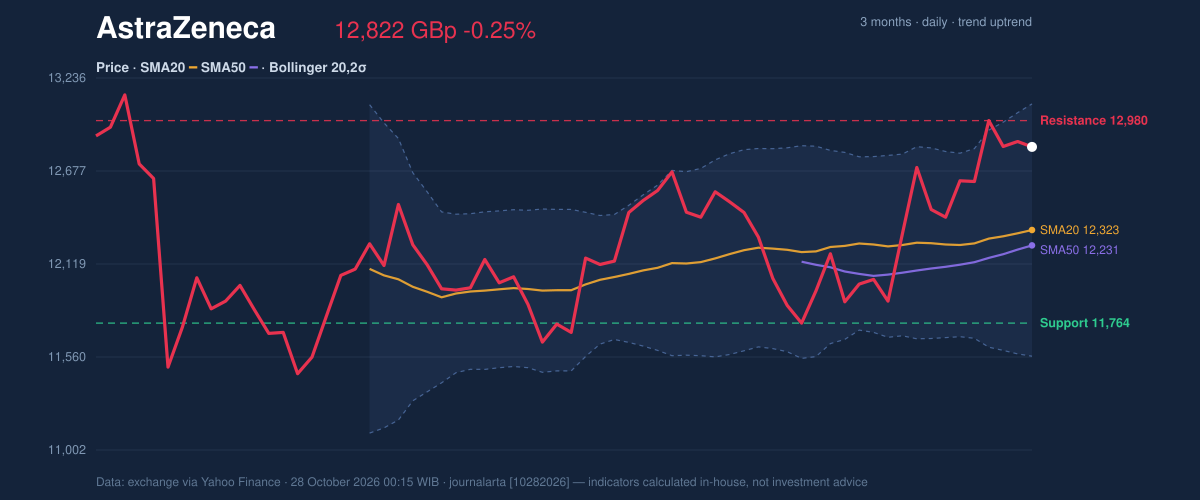
Data from the London Stock Exchange, compiled via Yahoo Finance, show AstraZeneca closed Tuesday's session of October 27, 2026 at 12,822.00 pence (GBp), down 0.25% from the previous close of 12,854.00. The one-day dip is small against the larger picture: the shares are up 1.62% over five days and 3.17% over one month, which is why the uptrend is the reason the stock is on the watchlist today.
Why AstraZeneca is in focus today
- Uptrend confirmed (5-day change 1.62%)
Selected automatically from 16 LSE (UK) stocks by a technical-signal score with daily weighted randomisation — not a recommendation.
Trend & Price Action
The price sits above both the 20-day simple moving average (SMA20), at 12,322.60, and the 50-day average (SMA50), at 12,230.64. A moving average is simply the mean closing price over a set number of days, so a stock trading above both is, on average, being bought at higher prices than recent buyers paid. The 20-day average itself rose 0.73% over five days, and a rising average is the cleaner signal: the trend is not just a spike but is pulling its own baseline upward. The two averages are also stacked in the right order, with the short one above the long one, although DATA records no new crossover, so this is a continuation of an established move rather than a fresh turn.
Position in the range matters too. The price is at 87% of its 20-day range, between support at 11,764.00 and resistance at 12,980.00. The three-month high and low are 13,164.00 and 11,404.00. The shares have therefore recovered most of the way up that band and sit about 158 pence under the 20-day ceiling, close enough that the next few sessions will test it.
Oscillators & Momentum
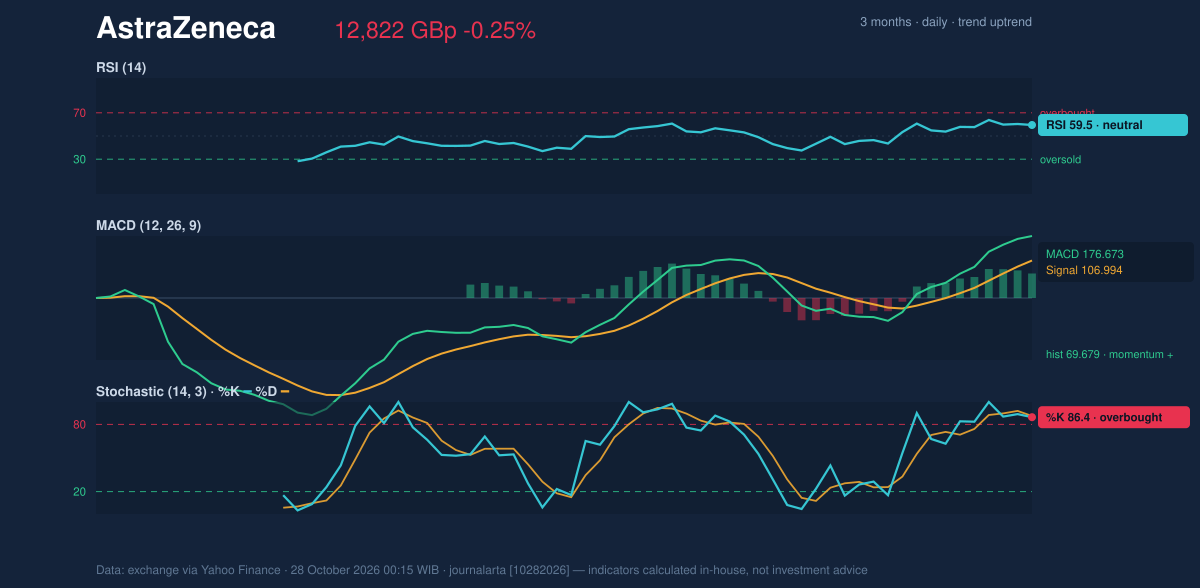
Momentum indicators agree on direction but disagree on how much room is left. The 14-day Relative Strength Index (RSI), which scores the pace of recent gains against losses on a 0–100 scale, reads 59.5, classed as neutral. It shows firm buying without the stretched readings that usually precede a pause. The Stochastic oscillator, which compares the close with the recent high-low range, tells a warmer story: %K at 86.4 and %D at 87.5 are in overbought territory. Overbought does not mean a fall is due; it means the price is closing near the top of its recent range, which is typical of a trend but leaves less cushion for a stumble.
The Moving Average Convergence Divergence (MACD) gauge supports the trend. The line is at 176.673 against a signal line of 106.994, leaving a histogram of 69.679. A positive and wide histogram means short-term momentum is running well ahead of the longer-term pace.
Volatility & Volume
The Bollinger Bands, a channel set two standard deviations either side of the 20-day average, span 11,565.32 to 13,079.88 with a width of 12.3%, a normal reading. The price sits at 83% of the band (%B), so it is in the upper part of the channel but not pressed against the 13,079.88 upper edge. The Average True Range (ATR), a measure of typical daily movement, is 292.43 pence, or 2.3% of the price, indicating moderate volatility. In practice, a swing of roughly that size in either direction on any given day would be ordinary.
Participation is the softer spot. Tuesday's volume of 2,178,329 shares was 0.8 times the 20-day average of 2,598,047, so the latest pullback came on lighter trading, which is less worrying than a drop on heavy volume. On-balance volume (OBV), which tallies volume on up days against down days, is still rising, suggesting buying has outweighed selling over the period.
Key Levels & Scenarios
A close above the 12,980.00 resistance would put the 13,079.88 upper Bollinger band and the 13,164.00 three-month high in view. If the price slips instead, the first cushion is the SMA20 near 12,322.60, followed by support at 11,764.00. The 20-day average is the level most closely watched by trend followers, since a close below it would challenge the rising-average argument.
Technical Verdict: HOLD (wait & see)
The verdict is HOLD (wait & see), based on the following:
- The trend is up: price above SMA20 and SMA50, with the 20-day average rising 0.73% over five days, and MACD histogram positive at 69.679.
- Stochastic at 86.4/87.5 is overbought and price is at 87% of its 20-day range, leaving limited room before resistance at 12,980.00.
- Volume at 0.8 times average does not yet confirm a breakout, even though OBV is rising.
- Ideal entry range: 12,322.60–12,400 area, around the SMA20 and the middle Bollinger band, where the price would be closer to trend support.
- Exit target: 12,980.00 (20-day resistance), then 13,079.88 (upper Bollinger band).
- Stop loss: below 11,764.00 (20-day support).
The verdict is invalidated if the price closes below 11,764.00, which would break the 20-day support and undermine the uptrend. This is technical analysis, not an investment recommendation. In plain terms: the trend is healthy, but the shares have already run a long way within their recent range, so the data favour patience over action.
| Indicator | Value |
|---|---|
| Last price | 12,822.00 GBp |
| Change (1 day / 5 days / 1 month) | -0.25% / 1.62% / 3.17% |
| SMA20 / SMA50 | 12,322.60 / 12,230.64 |
| Bollinger (upper / middle / lower) | 13,079.88 / 12,322.60 / 11,565.32 |
| RSI(14) | 59.5 |
| Stochastic %K / %D | 86.4 / 87.5 |
| MACD / signal / histogram | 176.673 / 106.994 / 69.679 |
| ATR(14) | 292.43 |
| Support / resistance (20 days) | 11,764.00 / 12,980.00 |
| 3-month high / low | 13,164.00 / 11,404.00 |
Tuesday's volume of 2,178,329 shares compared with a 20-day average of 2,598,047.
Summary Data AstraZeneca
| Last price | 12,822.00 GBp |
| Change 1 day / 5 days / 1 month | -0.25% / 1.62% / 3.17% |
| Trend / MA-cross | uptrend / none |
| SMA20 / SMA50 | 12,322.60 / 12,230.64 |
| RSI (14) / Stochastic %K | 59.5 / 86.4 |
| Bollinger %B / ATR | 83% / 292.43 |
| Support / Resistance 20 days | 11,764.00 / 12,980.00 |
| Data as of | 28 October 2026 00:15 WIB |
Disclaimer: This technical analysis is generated automatically from exchange data (via Yahoo Finance) and indicators calculated by JournalArta, for information and education only. The verdict and the entry, target and stop-loss levels are not investment advice or a solicitation to buy or sell any security. Investment decisions and their risks rest solely with the reader.
Track AstraZeneca share price daily: live levels, support/resistance and our full AstraZeneca analysis history.