Barclays Stock Gains 0.79% on Tuesday, Momentum Gains
On October 27, 2026: price 422.05 GBp, trend downtrend, RSI 38.9, support 407.00, resistance 457.55. technical analysis of barclays stock.
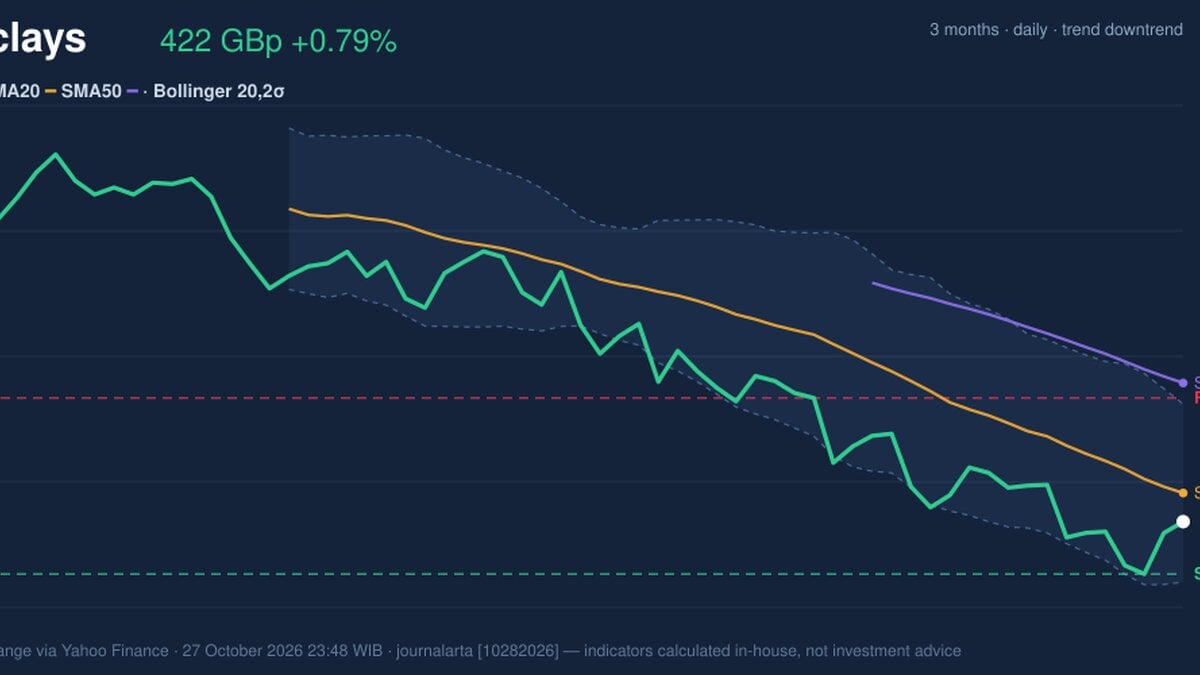
Barclays closed at 422.05 pence on the London Stock Exchange on Tuesday, October 27, 2026, up 0.79% on the day after a prior close of 418.75. The more telling signal sits beneath the surface: the MACD histogram, a gauge of whether downward momentum is fading or deepening, has just turned positive at 0.560. That is the reason the stock is on the watchlist today. The one-month change remains -8.05%, so the bounce is happening inside a damaged chart.
Why Barclays is in focus today
- MACD histogram has just turned positive
Selected automatically from 16 LSE (UK) stocks by a technical-signal score with daily weighted randomisation — not a recommendation.
The five-day change is 0.76%. A small gain, then, against a much larger monthly loss.
Trend & Price Action
The trend reads as a downtrend. The price sits below both the 20-day simple moving average (SMA20) at 430.26 and the 50-day average (SMA50) at 461.88. The 20-day average itself fell 2.56% over five days, meaning the recent price path has been consistently lower rather than a one-off dip. No new moving-average crossover has formed. With the shorter average already well under the longer one, the bearish arrangement is established rather than freshly triggered.
The distance to the SMA20, roughly 8 pence, is the first hurdle. Moving averages work like a running mean of what recent buyers paid; when the price is below them, many recent holders are sitting on losses and may be tempted to sell into any rally.
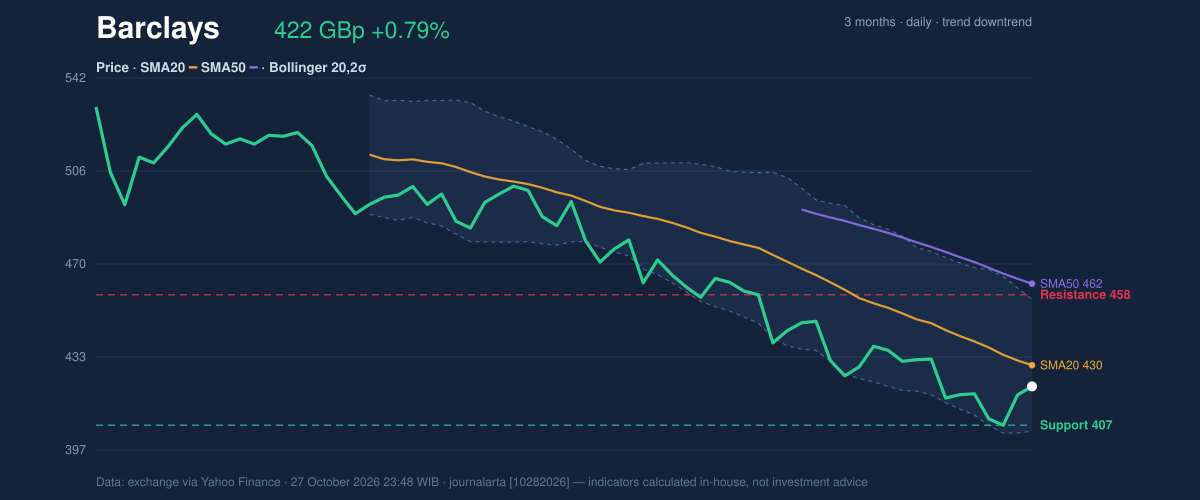
As shown in the chart, the stock trades in the lower part of its 20-day range, at about 30% of the span between support at 407.00 and resistance at 457.55. The three-month range runs from a high of 538.30 to a low of 399.60, so the shares are much closer to the bottom of that band than the top.
Oscillators & Momentum
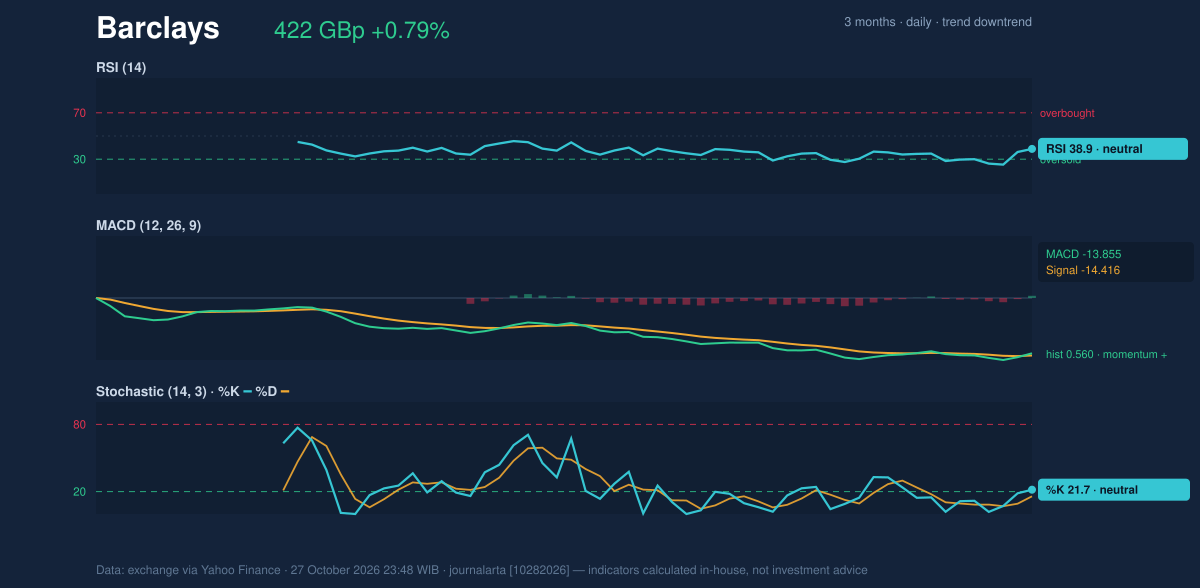
Momentum indicators paint a picture of selling pressure that is easing, not yet reversing. The 14-day Relative Strength Index (RSI), which scores the pace of recent gains against losses on a 0-100 scale, stands at 38.9, in neutral territory but closer to the oversold zone than to the overbought one. The Stochastic oscillator, which shows where the close sits within its recent range, has %K at 21.7 and %D at 15.8. Both are low, and %K above %D hints at an early upward turn.
The MACD line, which compares two moving averages of price, is at -13.855 against a signal line of -14.416. The line is still deeply negative, but it has moved above its signal line, producing the positive histogram of 0.560. In plain terms: the decline is losing speed, but it has not become a recovery.
Volatility & Volume
The Bollinger Bands, a channel set two standard deviations around the 20-day average, span 404.69 to 455.84. The width of 11.9% is classed as normal, and %B of 34% places the price in the lower half of the channel. The Average True Range (ATR), a measure of typical daily swing, is 16.21 pence, or 3.8% of the price. That is high for a large bank, so daily moves of this size should not be read as a breakout by themselves.
Volume is the weak link. The latest session traded 25,465,243 shares, only 0.6 times the 20-day average of 45,071,405, a thin turnout. Yet on-balance volume (OBV), which tallies volume on up days against down days, is rising. That suggests buying on advances has outweighed selling over the period, a modest positive, though the light volume today limits how much weight the bounce deserves.
Key Levels & Scenarios
Support at 407.00 sits just above the lower Bollinger Band at 404.69 and the three-month low of 399.60, forming a layered floor. A close below that cluster would show sellers regaining control and open the path toward the 399.60 low. On the upside, the SMA20 at 430.26 is the first test; clearing it would put the 457.55 resistance, which lies close to the upper band at 455.84, back in view.
Technical Verdict: HOLD (wait & see)
The verdict is HOLD (wait & see), based on three readings:
- The price is below the SMA20 and SMA50 with the 20-day average falling, which keeps the trend bearish.
- The MACD histogram has turned positive and the Stochastic is low, hinting at fading downside momentum.
- Volume at 0.6 times average does not confirm the bounce, even though OBV is rising.
The verdict is invalidated if the price falls below 404.69, the lower Bollinger Band, or closes above 457.55 resistance.
- Ideal entry range: 407.00 to 412.00, near support and the lower band.
- Exit target: 430.26 (SMA20) first, then 455.84 (upper band).
- Stop loss: below 399.60, the three-month low.
In plain English: the sell-off is slowing, but the chart has not yet shown enough strength to call it a turnaround, so patience is what the data supports. This is technical analysis, not an investment recommendation.
| Indicator | Value |
|---|---|
| Last price | 422.05 GBp |
| SMA20 / SMA50 | 430.26 / 461.88 |
| Bollinger (lower / mid / upper) | 404.69 / 430.26 / 455.84 |
| RSI(14) | 38.9 |
| Stochastic %K / %D | 21.7 / 15.8 |
| MACD / signal / histogram | -13.855 / -14.416 / 0.560 |
| ATR(14) | 16.21 |
| Support / resistance (20 days) | 407.00 / 457.55 |
| 3-month high / low | 538.30 / 399.60 |
The next test comes at the following session, when traders will see whether volume returns above the 45 million-share average and whether the price can reach the 430.26 line.
Summary Data Barclays
| Last price | 422.05 GBp |
| Change 1 day / 5 days / 1 month | 0.79% / 0.76% / -8.05% |
| Trend / MA-cross | downtrend / none |
| SMA20 / SMA50 | 430.26 / 461.88 |
| RSI (14) / Stochastic %K | 38.9 / 21.7 |
| Bollinger %B / ATR | 34% / 16.21 |
| Support / Resistance 20 days | 407.00 / 457.55 |
| Data as of | 27 October 2026 23:48 WIB |
Disclaimer: This technical analysis is generated automatically from exchange data (via Yahoo Finance) and indicators calculated by JournalArta, for information and education only. The verdict and the entry, target and stop-loss levels are not investment advice or a solicitation to buy or sell any security. Investment decisions and their risks rest solely with the reader.
Track Barclays share price daily: live levels, support/resistance and our full Barclays analysis history.