HSBC Stock Analysis: Drops 5.42%, RSI Oversold
On October 27, 2026: price 1,291.40 GBp, trend downtrend, RSI 26.6, support 1,291.40, resistance 1,497.60. technical analysis of hsbc stock.
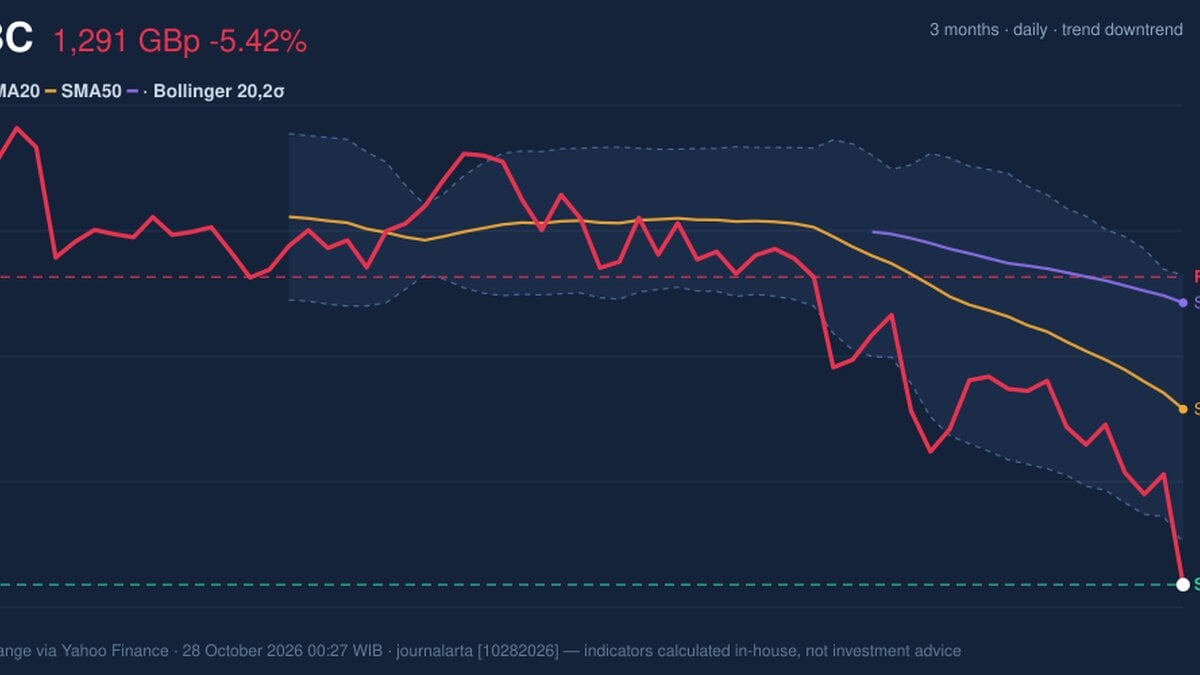
HSBC Holdings closed at 1,291.40 pence on the London Stock Exchange on Tuesday, October 27, 2026, down 5.42% in a single session from a previous close of 1,365.40. That is roughly 2.1 times the stock's average daily range, and it left the shares at their lowest close in 20 trading days. Volume reached 38,247,586 shares, about 1.7 times the 20-day average of 22,870,905.
Why HSBC is in focus today
- One-day move of -5.42%, about 2.1× its average daily range (ATR)
- Volume at 1.7× the 20-day average
- Closed at a 20-day low (1,291.40)
- RSI(14) at 26.6 — oversold zone
- Downtrend extending (5-day change -6.77%)
- Not covered by JournalArta in the last 14 days
Selected automatically from 16 LSE (UK) stocks by a technical-signal score with daily weighted randomisation — not a recommendation.
The decline extends a longer slide: the stock is down 6.77% over five days and 14.48% over one month, according to exchange data via Yahoo Finance.
Trend and Price Action
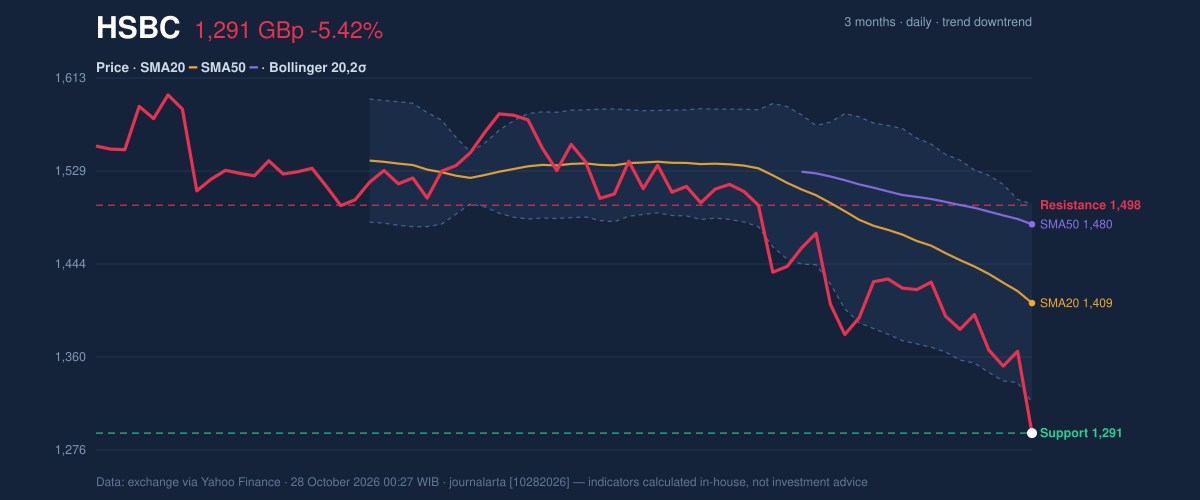
The price sits below the 20-day average (1,408.99), which in turn sits below the 50-day average (1,480.30). That ordering is the textbook shape of a downtrend: recent prices are lower than the medium-term norm, and the medium-term norm is lower than the longer one. The 20-day average itself fell 2.69% over five days, so the drag is building rather than fading. No new moving-average crossover has formed, meaning the trend damage is coming from price itself, not from a signal flip.
Price is also pressed against the floor of its recent range. The 20-day support is 1,291.40, identical to the last close, while 20-day resistance is 1,497.60. The stock sits at 0% of that range. The three-month low is 1,263.60 and the three-month high is 1,610.00, so the shares are only about 28 pence above the lowest level of the quarter.
[GRAFIK-PRICE_PLACEHOLDER]A support level is simply a price where buyers have previously stepped in. Here the support is the current price, so it has not yet been tested by a bounce. That makes it an unproven line.
Oscillators and Momentum
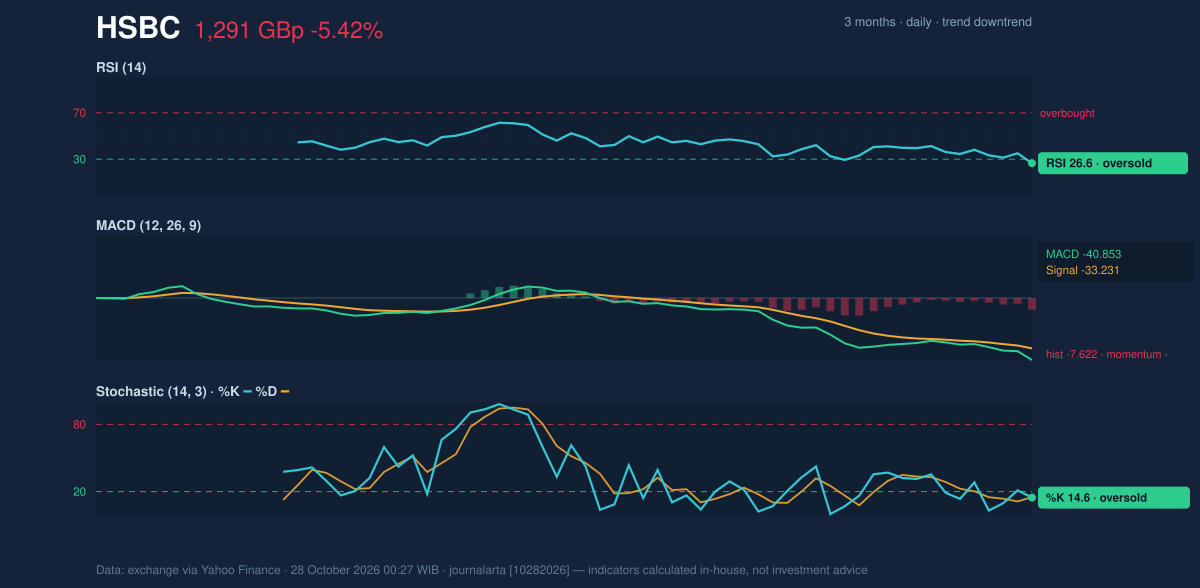
Momentum gauges agree with the price. The 14-day Relative Strength Index (RSI), which scores the speed of recent gains against losses on a 0-100 scale, stands at 26.6. Readings below 30 are conventionally labelled oversold. The Stochastic oscillator, which shows where the close sits within its recent high-low range, reads %K 14.6 and %D 15.1, also oversold.
Oversold does not mean a rebound is due. It means selling has been unusually one-sided. In strong downtrends, these gauges can stay depressed for extended periods.
The MACD, which compares a faster and slower average of prices, is at -40.853 against a signal line of -33.231. The histogram of -7.622 shows the gap between them is negative, so downward momentum remains in force and has not yet started to narrow.
Volatility and Volume
The close of 1,291.40 is below the lower Bollinger Band at 1,319.16, with %B at -15%. Bollinger Bands trace two standard deviations around the 20-day average; a close beneath the lower band marks a move that is statistically stretched. Band width is 12.8%, described as normal, so this is a sharp move inside an ordinary volatility regime, not a market already in turmoil. The 14-day Average True Range (ATR), a measure of typical daily movement, is 33.29 pence, or 2.6% of the price.
Volume matters here. A 1.7× surge on a falling day suggests heavier participation behind the decline, and on-balance volume (OBV), which adds volume on up days and subtracts it on down days, is falling. That points to selling pressure confirming the price drop rather than contradicting it.
Key Levels and Scenarios
If the stock holds 1,291.40 and the three-month low of 1,263.60 stays intact, the oversold readings could allow a pause or a retracement toward the lower band at 1,319.16, then the 20-day average at 1,408.99. If it slips below 1,263.60, it would be trading at a new three-month low, with no support from the quarter's data left beneath it.
Technical Verdict: HOLD (wait & see)
The verdict is HOLD (wait & see), for these reasons:
- Trend: the price is below both the 20-day and 50-day averages, and the 20-day average is falling, which argues against a reversal call.
- Momentum: RSI at 26.6 and Stochastic at 14.6 are oversold, which argues against extending the decline call; MACD remains negative.
- Volume: the 1.7× spike with falling OBV shows decisive selling, but no sign yet of stabilisation.
Reference levels from the data, for educational purposes:
- Ideal entry range: 1,291.40 to 1,319.16, between support and the lower Bollinger Band, if the price stabilises there.
- Exit target: 1,408.99, the 20-day average, with 1,497.60 as the extended resistance.
- Stop loss: below 1,263.60, the three-month low.
The verdict is invalidated if the price falls below 1,263.60, which would confirm a deeper breakdown. In plain terms: the shares have fallen hard and fast, but the signals do not yet show the drop has stopped, so waiting for clearer evidence is what the data supports. This is technical analysis, not an investment recommendation.
| Indicator | Value |
|---|---|
| Last price | 1,291.40 GBp |
| SMA20 / SMA50 | 1,408.99 / 1,480.30 |
| Bollinger (lower / mid / upper) | 1,319.16 / 1,408.99 / 1,498.82 |
| RSI(14) | 26.6 |
| Stochastic %K / %D | 14.6 / 15.1 |
| MACD / Signal / Histogram | -40.853 / -33.231 / -7.622 |
| ATR(14) | 33.29 |
| Support / Resistance (20 days) | 1,291.40 / 1,497.60 |
| 3-month low / high | 1,263.60 / 1,610.00 |
The three-month low of 1,263.60 pence sits just 27.80 pence below Tuesday's close.
Summary Data HSBC
| Last price | 1,291.40 GBp |
| Change 1 day / 5 days / 1 month | -5.42% / -6.77% / -14.48% |
| Trend / MA-cross | downtrend / none |
| SMA20 / SMA50 | 1,408.99 / 1,480.30 |
| RSI (14) / Stochastic %K | 26.6 / 14.6 |
| Bollinger %B / ATR | -15% / 33.29 |
| Support / Resistance 20 days | 1,291.40 / 1,497.60 |
| Data as of | 28 October 2026 00:27 WIB |
Disclaimer: This technical analysis is generated automatically from exchange data (via Yahoo Finance) and indicators calculated by JournalArta, for information and education only. The verdict and the entry, target and stop-loss levels are not investment advice or a solicitation to buy or sell any security. Investment decisions and their risks rest solely with the reader.
Track HSBC share price daily: live levels, support/resistance and our full HSBC analysis history.