LSEG Golden Cross Formed: Stock Drops 1.41% (October 27, 2026)
On October 27, 2026: price 9,208.00 GBp, trend uptrend, RSI 62.2, support 8,090.00, resistance 9,510.00. technical analysis of lseg stock.
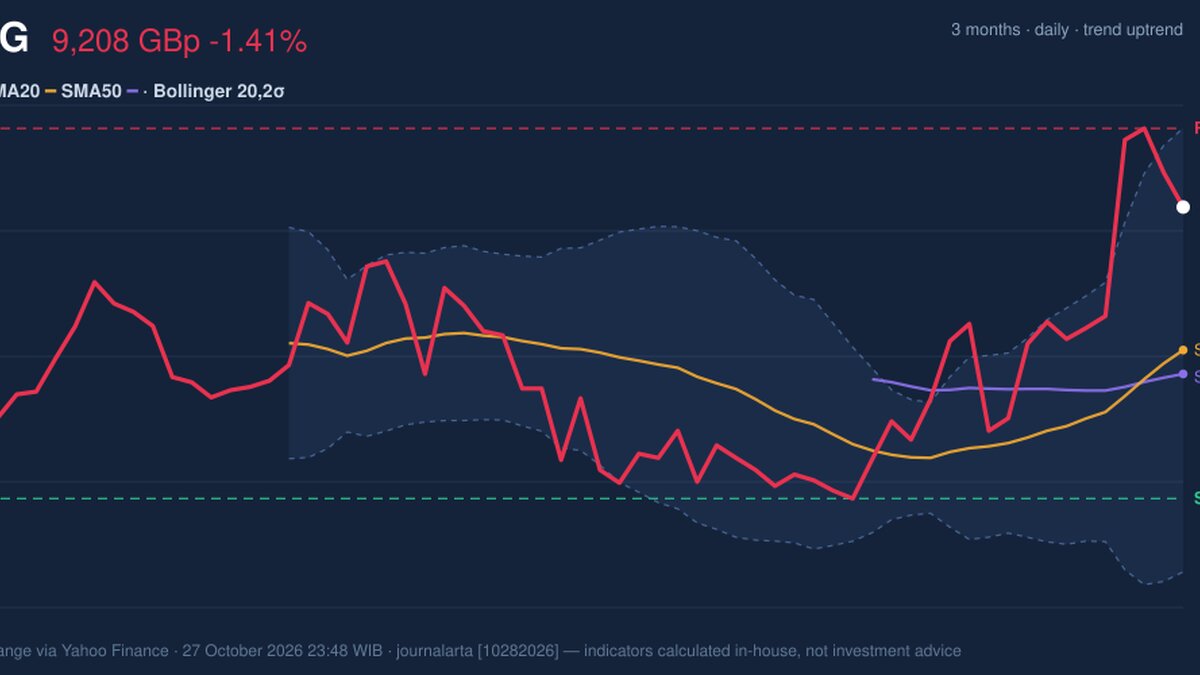
London Stock Exchange Group (LSEG) closed Tuesday's session on October 27, 2026 at 9,208.00 pence (GBp), down 1.41% on the day from a previous close of 9,340.00, yet still up 5.31% over five days and 12.54% over one month, according to exchange data compiled via Yahoo Finance. The pullback arrives just as a golden cross took shape: the 20-day simple moving average (SMA20) crossed above the 50-day (SMA50) two sessions before the latest session. A golden cross is a chart pattern in which a shorter-term average of closing prices climbs above a longer-term one, often read as a sign that recent buying has overtaken the broader trend.
Why LSEG is in focus today
- Fresh golden cross: SMA20 crossed above SMA50
- Uptrend confirmed (5-day change 5.31%)
Selected automatically from 16 LSE (UK) stocks by a technical-signal score with daily weighted randomisation — not a recommendation.
Trend & Price Action
The structure is constructive. The price sits above the SMA20 at 8,659.80, which in turn is above the SMA50 at 8,568.16. The gap between the two averages is narrow, about 92 pence, which says the crossover is young and has not yet been tested by a deep retreat. The 20-day average itself rose 3.13% over five days, so the trend is not just a price spike but is being absorbed into the averages.
Where the stock sits in its range matters as much. The price is at 79% of the 20-day band between support at 8,090.00 and resistance at 9,510.00, and the three-month high of 9,568.00 is only a little above the latest close. The three-month low is 8,012.00. In plain terms, the shares have climbed most of the way up their recent corridor, leaving less room before they meet a ceiling that has capped them before.
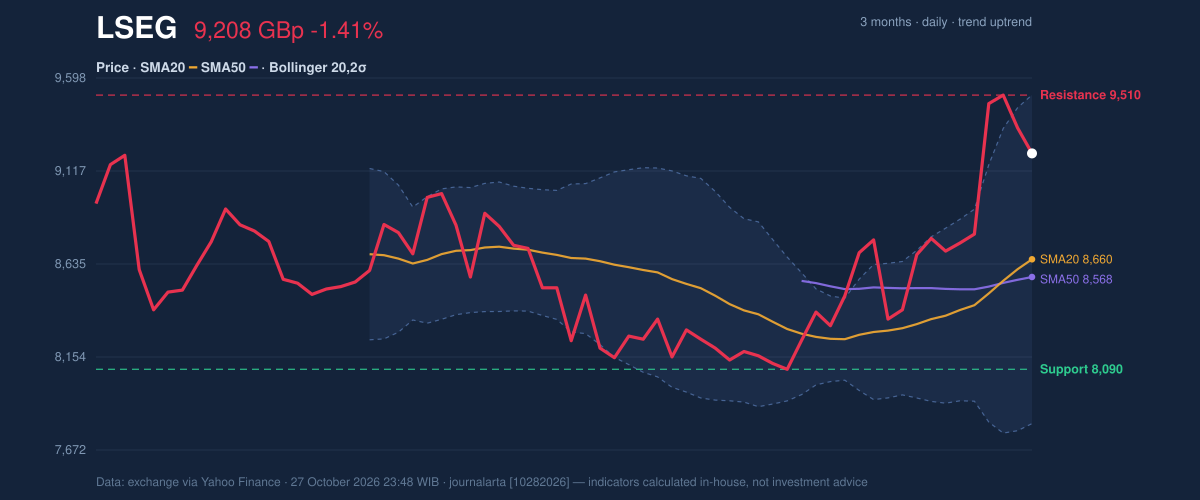
As the chart shows, the upper Bollinger Band at 9,510.81 almost coincides with the 20-day resistance at 9,510.00. Two separate measures pointing to the same area make it a zone of unusual interest. The %B reading of 82% shows the price in the upper part of its bands, which are 19.7% wide, a normal reading that signals neither a squeeze nor an extreme expansion.
Oscillators & Momentum
Momentum supports the trend without screaming excess. The relative strength index (RSI), which gauges the speed of recent gains against losses on a 0-100 scale, is 62.2, neutral, well short of the 70 level traders associate with overheating. The stochastic oscillator, which compares the close with its recent high-low range, shows %K at 73.7 and %D at 84.3, also neutral. With %K now below %D, the short-term line has rolled under its slower companion, consistent with the one-day drop and a hint that near-term energy is cooling.
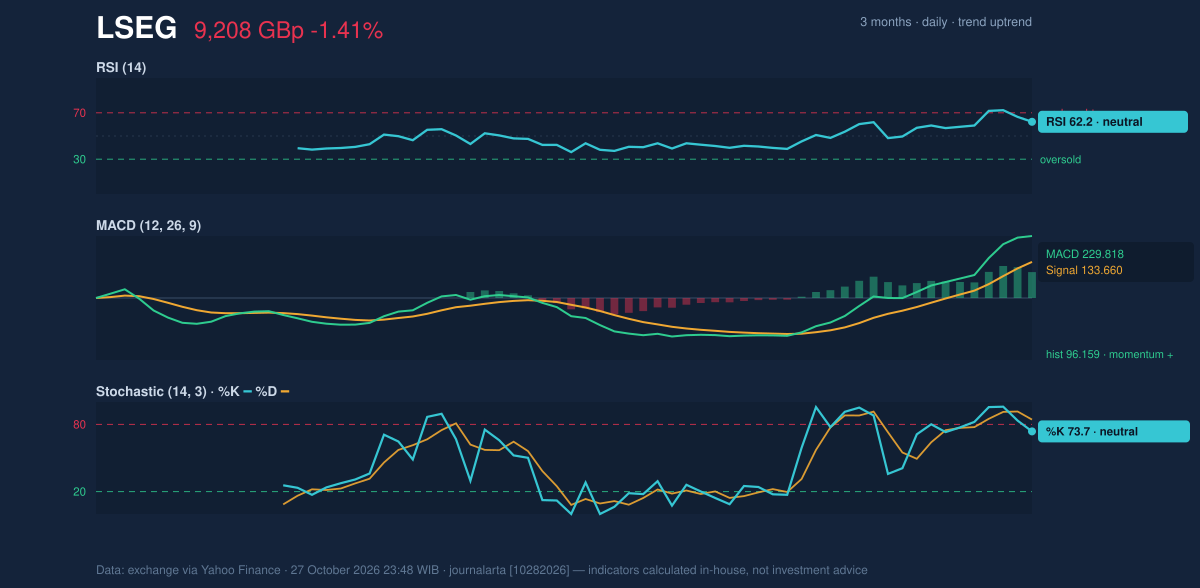
The MACD, a gauge built from the gap between two moving averages, stands at 229.818 against a signal line of 133.660, leaving a histogram of 96.159, signalling positive momentum. That is a wide spread, so the broader push remains intact even as the shorter-term stochastic wobbles.
Volatility & Volume
The average true range (ATR), a measure of typical daily movement, is 302.31 pence, or 3.3% of the price, which marks moderate volatility. Put simply, a swing of roughly 300 pence in a day is ordinary for this stock right now, so a move of that size should not by itself be read as a change of character.
Volume is the less comfortable part. Tuesday's turnover of 1,142,900 shares was 0.8 times the 20-day average of 1,378,204, meaning the dip happened on lighter participation. That is mildly reassuring, since sellers did not show conviction. Yet the on-balance volume (OBV) line, which tallies volume on up days against down days, is rising, so cumulative buying pressure still backs the advance.
Key Levels & Scenarios
Resistance clusters at 9,510 to 9,568, combining the 20-day ceiling, the upper Bollinger Band and the three-month high. A close through that area would extend the range upward; a failure there would keep the stock oscillating inside its band. On the downside, the SMA20 near 8,659.80 is the first moving-average cushion, then the SMA50 at 8,568.16, with support at 8,090.00 below. Losing the averages would put the new golden cross in doubt.
Technical Verdict: HOLD (wait & see)
HOLD (wait & see) is the reading the indicators support, for three reasons:
- The trend is positive: the golden cross, price above SMA20 and a positive MACD histogram of 96.159.
- Price is 79% of the way up its range and close to a stacked resistance zone at 9,510 to 9,568, limiting near-term room.
- Stochastic %K has slipped below %D while volume was 0.8 times average, hinting at a pause rather than a fresh surge.
The verdict would be invalidated if the price closes below the SMA50 at 8,568.16, or alternatively if it breaks decisively above 9,568.00 on stronger volume.
- Ideal entry range: 8,659.80 to 8,568.16, the SMA20-SMA50 zone.
- Exit target: 9,510.81, the upper Bollinger Band and 20-day resistance, with 9,568.00 as the extension.
- Stop loss: below 8,090.00, the 20-day support.
In plain English: the trend is healthy, but the stock is near a ceiling, so patience looks more sensible than chasing. This is technical analysis, not an investment recommendation.
| Indicator | Value |
|---|---|
| Last price | 9,208.00 GBp |
| 1 day / 5 days / 1 month | -1.41% / 5.31% / 12.54% |
| SMA20 / SMA50 | 8,659.80 / 8,568.16 |
| Bollinger upper / lower | 9,510.81 / 7,808.79 |
| RSI(14) | 62.2 |
| Stochastic %K / %D | 73.7 / 84.3 |
| MACD / signal | 229.818 / 133.660 |
| ATR(14) | 302.31 |
| Support / resistance (20 days) | 8,090.00 / 9,510.00 |
| 3-month high / low | 9,568.00 / 8,012.00 |
Summary Data LSEG
| Last price | 9,208.00 GBp |
| Change 1 day / 5 days / 1 month | -1.41% / 5.31% / 12.54% |
| Trend / MA-cross | uptrend / golden |
| SMA20 / SMA50 | 8,659.80 / 8,568.16 |
| RSI (14) / Stochastic %K | 62.2 / 73.7 |
| Bollinger %B / ATR | 82% / 302.31 |
| Support / Resistance 20 days | 8,090.00 / 9,510.00 |
| Data as of | 27 October 2026 23:48 WIB |
Disclaimer: This technical analysis is generated automatically from exchange data (via Yahoo Finance) and indicators calculated by JournalArta, for information and education only. The verdict and the entry, target and stop-loss levels are not investment advice or a solicitation to buy or sell any security. Investment decisions and their risks rest solely with the reader.
Track LSEG share price daily: live levels, support/resistance and our full LSEG analysis history.