GS Stock Technicals: Gains 2.07% on Tuesday, Testing Key Resistance
On October 27, 2026: price 911.77 USD, trend sideways, RSI 50.3, support 875.68, resistance 911.77. technical analysis of gs stock. GS Stock Technicals — full…
Trend & Price Action
The move left Goldman Sachs 3.05% higher over five sessions, although the shares were down 0.49% over one month. That mixed picture fits the data’s sideways trend classification: the latest rally has not yet reversed the broader lack of direction. The price is above its 20-day moving average of $891.49, but remains below its 50-day average of $954.01. The 20-day average fell 0.84% over five days, suggesting the short-term trend line is still sloping down despite the latest advance. No new moving-average crossover has formed. The stock’s position above the upper Bollinger Band—$910.37—puts it at 104% of the band’s range. Bollinger Bands track how far prices move around a recent average; a narrowing band can precede a larger move, but does not indicate which direction it will take. Here, the 4.2% band width signals a squeeze, while the price has moved above the band. That is a potential breakout, not yet proof of a durable trend change. As shown in the chart, the shares are above the 20-day average and upper band but still below the 50-day average.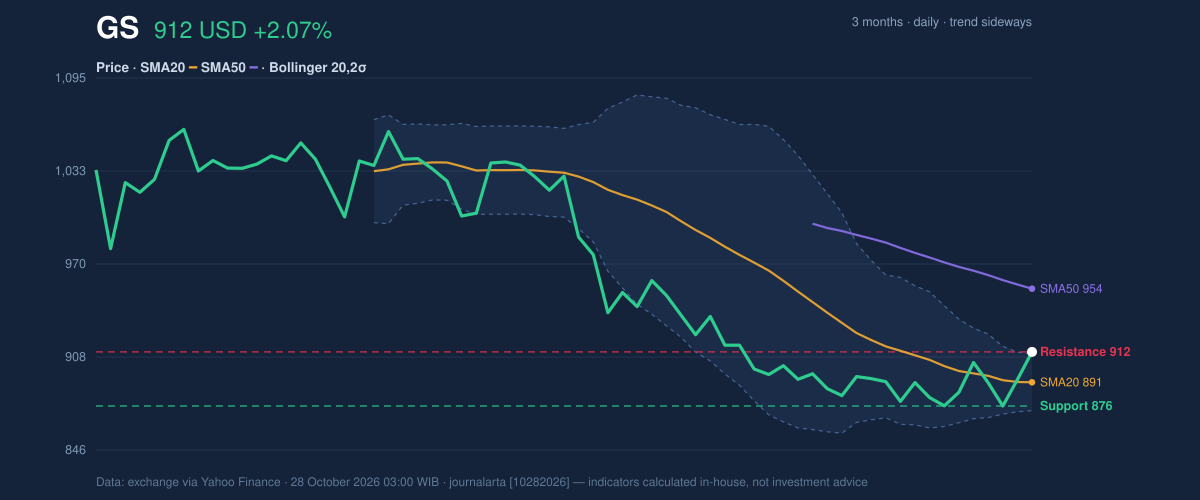
Oscillators & Momentum
Momentum indicators are improving, but they do not all point to the same strength. The MACD histogram is positive at 5.982, with MACD at -15.366 above its signal line at -21.348. In plain language, recent downward momentum has eased and shorter-term momentum has turned positive, even though the MACD itself remains below zero. That is consistent with an early improvement rather than a confirmed longer-term uptrend. The RSI is 50.3, a neutral reading that suggests neither strong buying pressure nor an oversold rebound. The Stochastic readings—%K at 73.3 and %D at 48.0—are also classified as neutral, although the gap between them indicates stronger near-term momentum. The indicators lean toward recovery, but the neutral RSI and price’s position below the 50-day average temper that signal.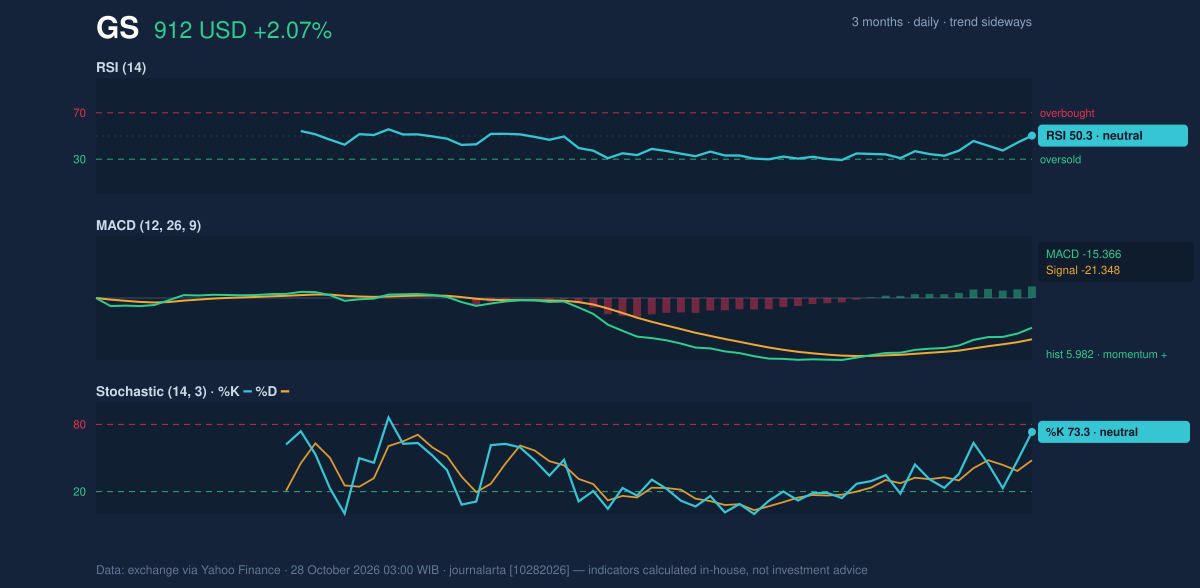
Volatility & Volume
The Bollinger squeeze points to unusually compressed recent movement, and the move beyond the upper band raises the possibility that volatility is expanding. The average true range, or ATR, is $24.86, equal to 2.7% of the share price; this indicates moderate typical price movement, not a forecast of direction. Participation was less convincing. Trading volume was 1,850,500 shares, or 0.8 times the 20-day average of 2,306,835, while on-balance volume (OBV)—a running measure that combines price direction with volume—was falling. A breakout on thin volume and declining OBV has weaker confirmation than one supported by rising participation.Key Levels & Scenarios
Holding above $911.77 would show that the former resistance area is being accepted as a floor, while sustained strength toward the $954.01 50-day average would help address the broader trend weakness. Conversely, a retreat below $875.68 would undercut the stated 20-day support and challenge the breakout case. The $891.49 20-day average is an intermediate reference point between those levels.Technical Verdict: HOLD (wait & see)
The technical picture is cautiously constructive, but not sufficiently confirmed for a directional verdict beyond HOLD. The positive MACD histogram and price above the 20-day average favor recovery; the squeeze breakout adds potential for a larger move. Against that, the shares remain below the 50-day average, volume is below normal, and OBV is falling. - Ideal Entry Range: $891.49–$911.77, using the 20-day average and current resistance as reference levels. - Exit Target (Target Price): $954.01, the 50-day moving average and next stated resistance reference. - Stop Loss: $875.68, the 20-day support level. - Invalidation: The HOLD assessment is invalidated if the price falls below $875.68. In plain English, the shares show early signs of recovery, but the breakout still needs stronger market participation and follow-through.Market data: exchange data via Yahoo Finance, for the Tuesday, October 27, 2026 session. Technical analysis is not an investment recommendation.
Why GS is in focus today
- Breaking out of a Bollinger squeeze (band width 4.2%)
- Not covered by JournalArta in the last 14 days
Selected automatically from 30 NYSE (US) stocks by a technical-signal score with daily weighted randomisation — not a recommendation.
Summary Data GS
| Last price | 911.77 USD |
| Change 1 day / 5 days / 1 month | 2.07% / 3.05% / -0.49% |
| Trend / MA-cross | sideways / none |
| SMA20 / SMA50 | 891.49 / 954.01 |
| RSI (14) / Stochastic %K | 50.3 / 73.3 |
| Bollinger %B / ATR | 104% / 24.86 |
| Support / Resistance 20 days | 875.68 / 911.77 |
| Data as of | 28 October 2026 03:00 WIB |
Disclaimer: This technical analysis is generated automatically from exchange data (via Yahoo Finance) and indicators calculated by JournalArta, for information and education only. The verdict and the entry, target and stop-loss levels are not investment advice or a solicitation to buy or sell any security. Investment decisions and their risks rest solely with the reader.
Track GS stock price daily: live levels, support/resistance and our full GS analysis history.