MA Stock Drops 0.59%, Momentum Gains In Focus
On October 27, 2026: price 609.85 USD, trend uptrend, RSI 58.8, support 550.00, resistance 633.21. technical analysis of ma stock. MA Stock Drops — full…
Trend & Price Action
Mastercard’s share price remains above its 20-day simple moving average (SMA) of $594.77 and its 50-day average of $583.49. The 20-day average rose 2.39% over five days, a signal that the near-term trend is still pointing upward even as the stock’s latest daily and weekly returns have turned negative. No new moving-average crossover was recorded, so there is no fresh signal from the relationship between the two averages. The distinction matters: the averages describe the underlying trend, while the recent price losses show short-term pressure. The stock is at 72% of its 20-session range, closer to the $633.21 resistance than the $550 support. It is also near its three-month high of $633.29, leaving limited room before a level where selling pressure may emerge. As shown in the chart, the price remains above its moving averages, but resistance is close.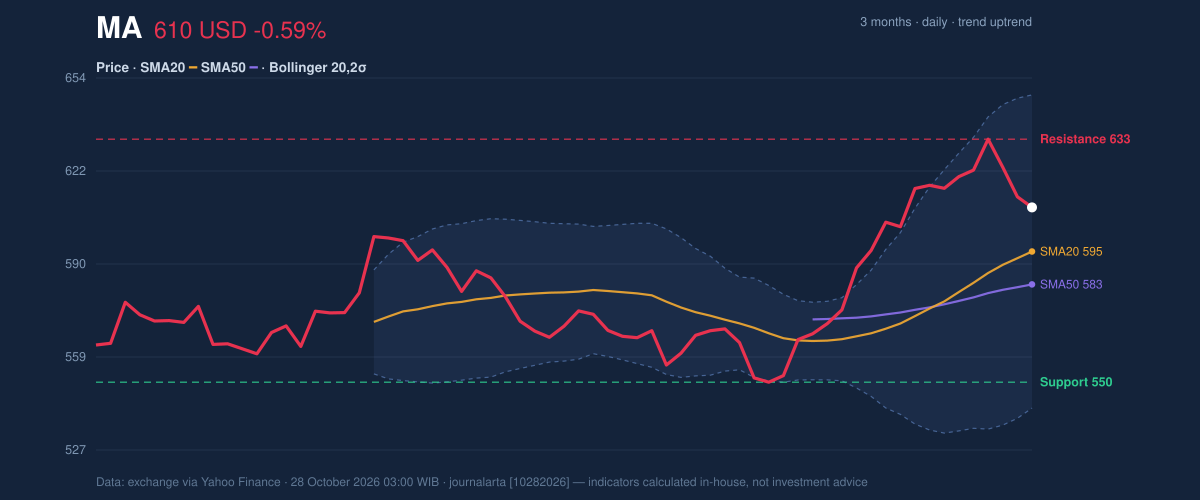
Oscillators & Momentum
Momentum indicators are positive but not emphatic. The 14-day Relative Strength Index (RSI), which gauges the pace of recent gains and losses, stands at 58.8, in neutral territory. The Stochastic oscillator is also neutral, with %K at 63.8 and %D at 73.5. These readings do not show an oversold rebound or a clear overbought extreme; instead, they suggest the pullback has not yet erased the recent upward momentum. The Moving Average Convergence Divergence (MACD) remains constructive: MACD is 13.241, above its 11.843 signal line, with a positive 1.397 histogram. The histogram measures the gap between the MACD line and its signal, so its positive reading indicates that upward momentum still has the advantage. That is confirmation, not a guarantee: if price continues falling, momentum may weaken before the longer-term averages turn lower.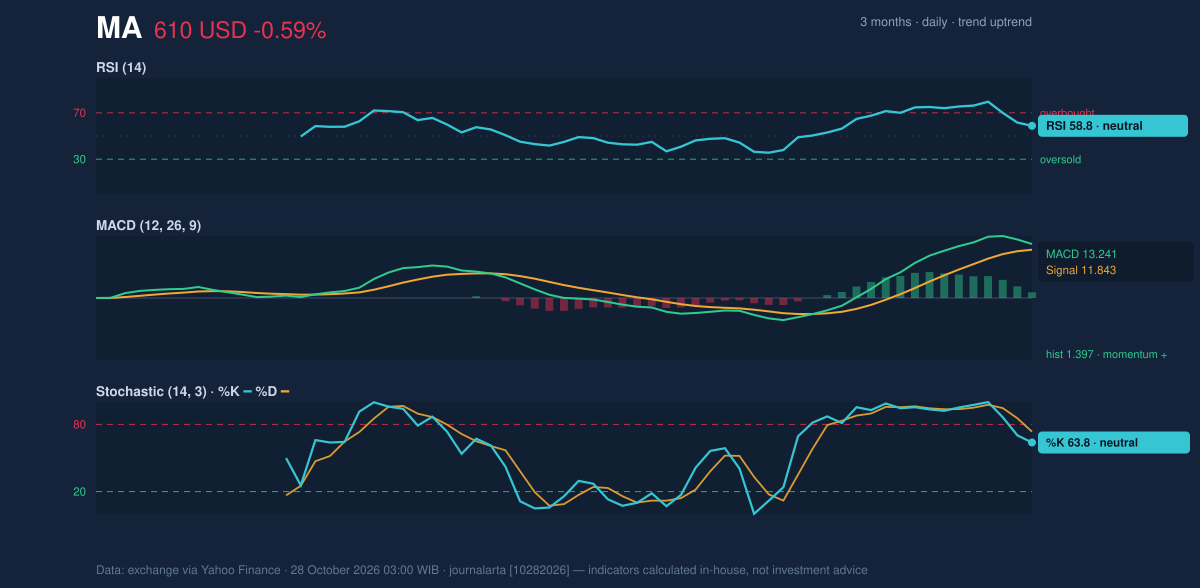
Volatility & Volume
The Bollinger Bands place the stock in the upper half of its recent price envelope. The bands run from $541.15 to $648.38, with the middle line at $594.77; the 64% %B reading means the share price is above the band midpoint but below the upper boundary. The 18.0% band width is normal, not a squeeze—a squeeze describes unusually narrow bands that can precede a larger move. Current bands therefore indicate neither unusually compressed trading nor a volatility breakout. Average True Range (ATR), a measure of typical price movement, is $10.80, or 1.8% of the share price, pointing to moderate volatility. Volume of 3,457,600 shares was 1.1 times the 20-session average of 3,098,765, while OBV, which tracks whether volume is flowing more on rising or falling sessions, was increasing. That combination suggests participation still leans supportive, although the latest decline means volume has not yet confirmed a decisive continuation higher.Key Levels & Scenarios
Resistance sits at $633.21, with the three-month high of $633.29 nearby. A sustained move above that zone would clear the nearest technical ceiling; failure to do so would leave the stock vulnerable to further consolidation. Below, the 20-day average at $594.77 is the first trend reference. The 50-day average at $583.49 is a deeper reference, while $550.00 is the stated 20-session support. A break below that support would weaken the current uptrend thesis.Technical Verdict: HOLD (wait & see)
The technical picture is constructive but not decisive: price remains above rising short- and medium-term averages; MACD is positive; and OBV is rising. Against that, the stock has slipped over five days and faces resistance close to its three-month high, while RSI and Stochastic remain neutral rather than signaling a strong acceleration. - Ideal entry range: $594.77–$609.85, anchored to the 20-day average and the latest price. - Exit target: $633.21–$648.38, spanning resistance and the upper Bollinger Band. - Stop-loss protection: $550.00, the stated 20-session support. - Invalidation: the verdict is invalidated if price falls below $550.00. For non-traders, this means the trend still points upward, but resistance and the recent pullback leave the next move unconfirmed.Market data: exchange data via Yahoo Finance, as of the Tuesday, October 27, 2026 session. Technical analysis is not an investment recommendation.
Summary Data MA
| Last price | 609.85 USD |
| Change 1 day / 5 days / 1 month | -0.59% / -1.70% / 8.21% |
| Trend / MA-cross | uptrend / none |
| SMA20 / SMA50 | 594.77 / 583.49 |
| RSI (14) / Stochastic %K | 58.8 / 63.8 |
| Bollinger %B / ATR | 64% / 10.80 |
| Support / Resistance 20 days | 550.00 / 633.21 |
| Data as of | 28 October 2026 03:00 WIB |
Disclaimer: This technical analysis is generated automatically from exchange data (via Yahoo Finance) and indicators calculated by JournalArta, for information and education only. The verdict and the entry, target and stop-loss levels are not investment advice or a solicitation to buy or sell any security. Investment decisions and their risks rest solely with the reader.
Track MA stock price daily: live levels, support/resistance and our full MA analysis history.