JPM Stock Gains 0.52%, Testing Key Resistance In Focus
On October 27, 2026: price 335.79 USD, trend sideways, RSI 47.6, support 329.58, resistance 339.72. technical analysis of jpm stock. JPM Stock Gains — full…
By matthew jonathan
October 28, 20264 min read
JPM Stock Gains 0.52%, Testing Key Resistance In Focus
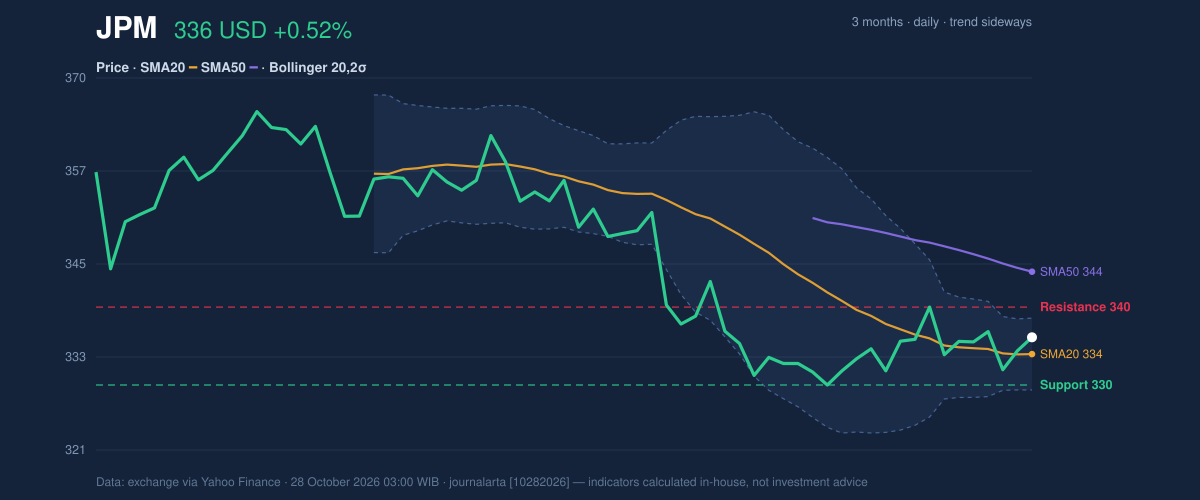
JPMorgan Chase shares rose 0.52% to $335.79 in Tuesday’s session, October 27, 2026, extending a modest five-day gain of 0.16%. The stock has not been covered by JournalArta in the past 14 days, while its chart shows a market caught between support near $330 and resistance below $340. The move is small.
That restrained trading reflects a sideways trend rather than a decisive break in either direction. JPMorgan finished above its 20-day moving average of $333.61, a measure of the recent trading average, but remained below its 50-day average of $344.33. The 20-day average itself fell 0.26% over five days, suggesting that the short-term price floor is not yet strengthening. No new moving-average crossover has formed.
Trend & Price Action
The price sits 61% of the way through its 20-session range, between support at $329.58 and resistance at $339.72. That position is above the midpoint, but not close enough to resistance to establish a breakout. JPMorgan’s three-month range is wider, from $325.07 to $366.50, putting the latest close well below the period high.
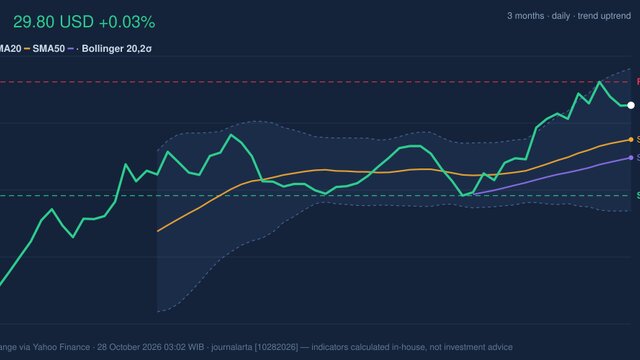
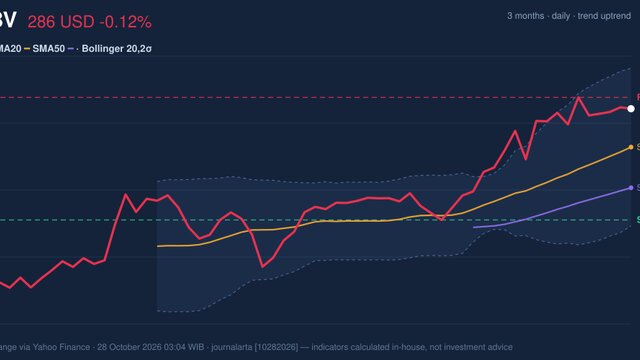
The Bollinger Bands—price bands that widen and narrow with recent volatility—are squeezed to a width of 2.8%. A squeeze signals that price movement has contracted; it can precede a larger move, but does not predict its direction. JPMorgan’s close was at 73% of the band range, closer to the upper band at $338.30 than the lower band at $328.93. The narrow bands and position near the upper edge make $339.72 a meaningful test, not a confirmed breakout.3-month price action chart of JPM: price, SMA20/50, Bollinger, support & resistance. Data: exchange via Yahoo Finance.
Oscillators & Momentum
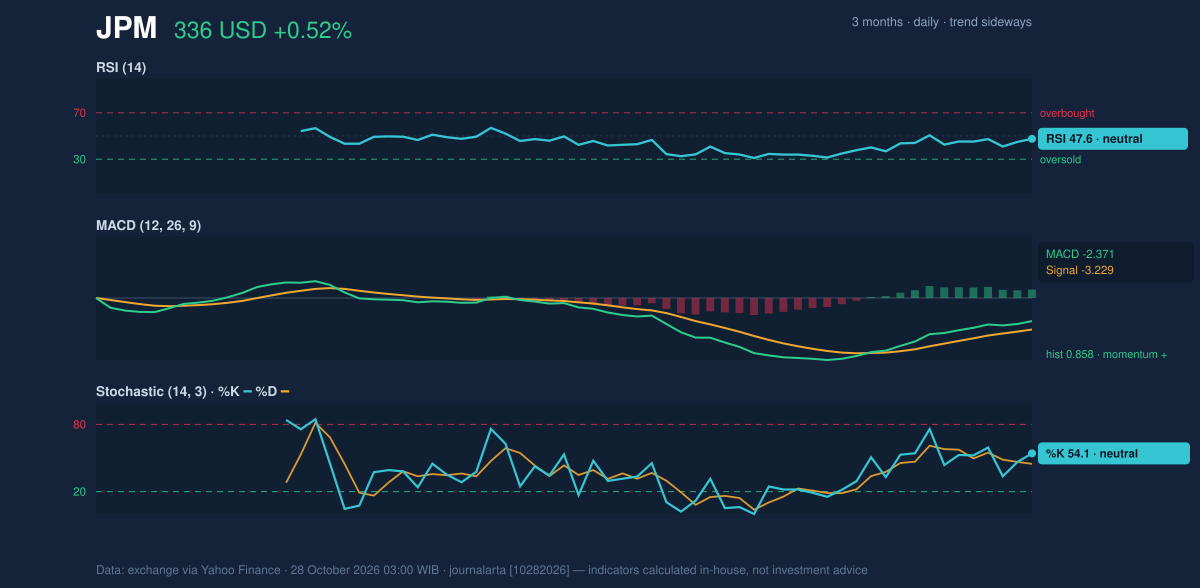
Momentum readings are mixed but lean mildly positive. The relative strength index, or RSI, is 47.6, a neutral reading that indicates neither strong buying pressure nor an oversold condition. The Stochastic oscillator is also neutral, with %K at 54.1 and %D at 44.7. Its faster line is above the slower one, consistent with a modest near-term improvement, but not a strong signal on its own.
The MACD histogram is positive at 0.858, while the MACD line remains negative at -2.371. The histogram compares the MACD line with its signal line; a positive reading means the gap is moving in a more constructive direction, even though the broader MACD level remains below zero. That combination points to improving momentum within a still-uncertain trend, rather than established upward momentum.Momentum chart of JPM: RSI(14), MACD, Stochastic. Data: exchange via Yahoo Finance.
Volatility & Volume
Average true range (ATR), a measure of typical price movement, is $6.31, or 1.9% of the share price—moderate volatility by the figures provided. The session’s volume was 4,711,400 shares, around 0.7 times the 20-session average of 7,161,690. That lighter participation weakens the significance of the day’s gain: the price rose, but trading activity did not confirm a broad increase in demand.
On-balance volume (OBV), which tracks whether volume is flowing more on rising or falling sessions, is rising. That is a supportive sign, but with current volume below average it does not yet outweigh the stock’s sideways structure and position below its 50-day average.
Key Levels & Scenarios
A sustained move above $339.72 would clear the stated 20-session resistance and could bring the 50-day average at $344.33 into focus. Failure to hold the 20-day average at $333.61 would weaken the short-term structure; a break below $329.58 would put the lower Bollinger Band at $328.93 in view. Those are conditional levels, not forecasts.
The technical picture is balanced: modestly positive momentum and rising OBV meet a sideways trend, below-average volume and a falling 20-day average.
Technical Verdict: HOLD
HOLD (wait & see) fits the mixed signals. The price is above the 20-day average, MACD momentum is improving and OBV is rising; against that, shares remain below the 50-day average, RSI and Stochastic are neutral, and volume is below its 20-session norm. The verdict is invalidated if the price falls below $329.58, the stated 20-session support.
- Ideal entry range: $333.61–$339.72, bounded by the 20-day average and 20-session resistance.
- Exit target: $344.33, the 50-day average.
- Stop-loss protection: $328.93, the lower Bollinger Band.
For non-traders, this means the chart has some improving signals but has not yet shown a clear, volume-backed direction.
Metric
Reading
Last price
$335.79
Daily / five-day / one-month change
0.52% / 0.16% / 0.24%
SMA20 / SMA50
$333.61 / $344.33
RSI / Stochastic
47.6 / neutral
MACD histogram
0.858
Support / resistance
$329.58 / $339.72
Session volume / 20-session average
4,711,400 / 7,161,690
Summary Data JPM
Last price
335.79 USD
Change 1 day / 5 days / 1 month
0.52% / 0.16% / 0.24%
Trend / MA-cross
sideways / none
SMA20 / SMA50
333.61 / 344.33
RSI (14) / Stochastic %K
47.6 / 54.1
Bollinger %B / ATR
73% / 6.31
Support / Resistance 20 days
329.58 / 339.72
Data as of
28 October 2026 03:00 WIB
Disclaimer: This technical analysis is generated automatically from exchange data (via Yahoo Finance) and indicators calculated by JournalArta, for information and education only. The verdict and the entry, target and stop-loss levels are not investment advice or a solicitation to buy or sell any security. Investment decisions and their risks rest solely with the reader.