On October 27, 2026: price 29.80 USD, trend uptrend, RSI 62.0, support 27.41, resistance 30.42. technical analysis of pfe stock. PFE Stock Gains — full details…
By matthew jonathan
October 28, 20264 min read
PFE Stock Gains 0.03% on Tuesday, Momentum Gains
Pfizer shares closed at $29.80 on Tuesday, October 27, up 0.03% for the session but down 1.03% over five days. The contrast points to a short pause within a stronger monthly move: the stock gained 3.76% over one month and remains above its 20-day and 50-day averages. That supports a constructive technical picture, though the price is nearing resistance and traded on below-average volume.
Trend & Price Action
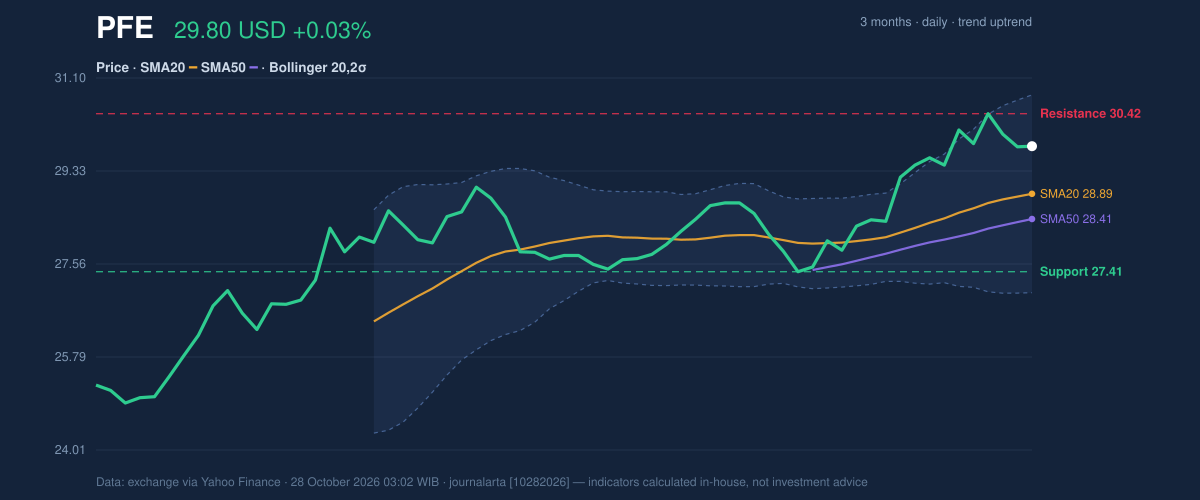
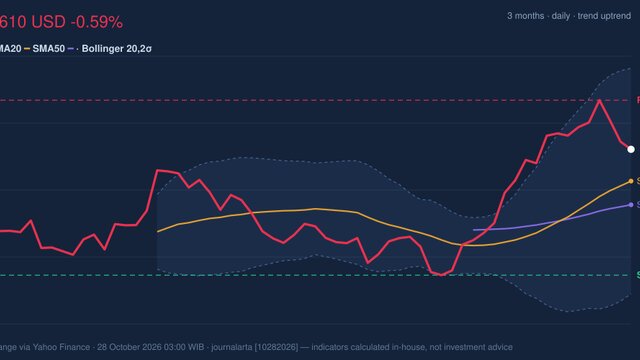
Pfizer’s price sits above the 20-day moving average at $28.89 and the 50-day average at $28.41, while the 20-day average rose 1.26% over five days. That rising short-term average and the price’s position above both measures indicate that recent strength has not yet been undone by the pullback. There is no new moving-average crossover, so the trend signal comes from the existing price structure rather than a fresh confirmation.
The stock is at 79% of its 20-session range, between support at $27.41 and resistance at $30.42. It is also close to its three-month high of $30.44, making the area around resistance consequential: a move through it would put the shares above the recent trading range, while failure there would leave the advance vulnerable to a retreat toward the moving averages. As shown in the chart, price is also below the upper Bollinger band at $30.78, which frames nearby resistance without indicating that the shares have reached the band’s outer boundary.
3-month price action chart of PFE: price, SMA20/50, Bollinger, support & resistance. Data: exchange via Yahoo Finance.
Oscillators & Momentum
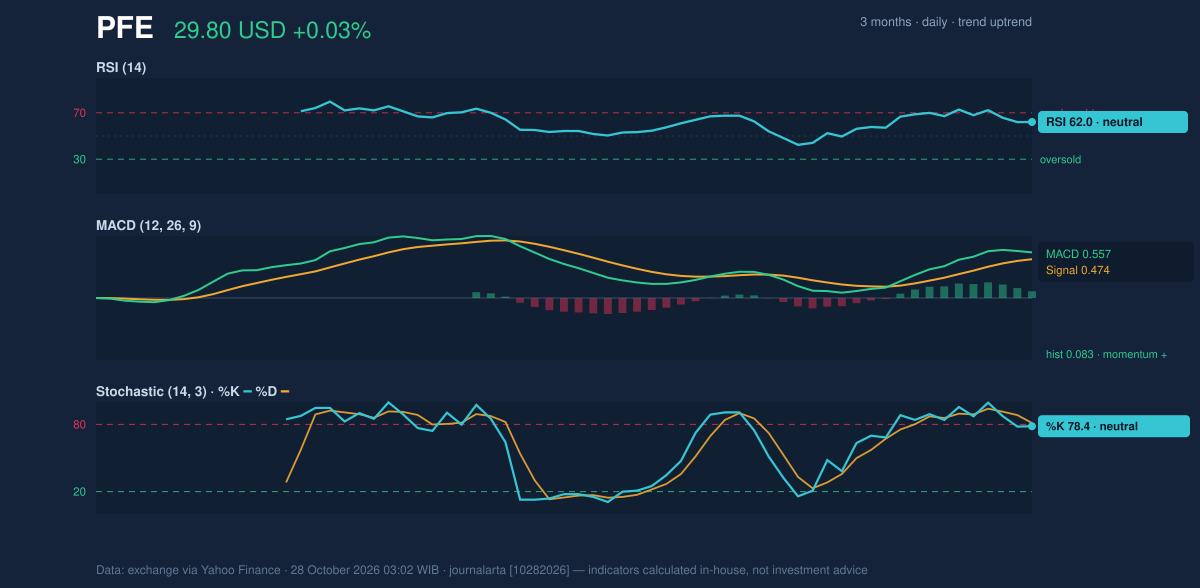
Momentum readings are positive but not unanimous in their strength. RSI is 62.0, a neutral reading: it reflects upward momentum without reaching a level that, on this measure, would signal an overheated market. The Stochastic oscillator is also labeled neutral, with %K at 78.4 and %D at 81.3. Its lines are near the upper part of their scale, but their classification cautions against treating that position alone as a confirmed reversal signal.
MACD offers the clearer confirmation. MACD is 0.557, above its 0.474 signal line, with a positive 0.083 histogram. In plain terms, the measure of short-term price momentum remains above its comparison line, consistent with the broader uptrend. The different readings matter: momentum supports the advance, but the neutral oscillators and proximity to resistance leave room for hesitation.
Momentum chart of PFE: RSI(14), MACD, Stochastic. Data: exchange via Yahoo Finance.
Volatility & Volume
The Bollinger bands are at normal width, with a 13.0% spread and a %B reading of 74%. %B locates the share price within the band, from the lower boundary to the upper one; 74% places Pfizer in the upper portion, but not at the top. That fits a firm trend approaching resistance rather than an established volatility breakout. ATR is $0.56, or 1.9% of the share price, indicating moderate typical movement.
Volume was 25,586,900 shares, or 0.9 times the 20-session average of 29,412,565. That lighter participation makes the latest close a less forceful confirmation of demand than a higher-volume advance would be. OBV, a cumulative measure that compares volume on rising and falling sessions, is rising, however, suggesting that buying pressure has been supportive over the broader period.
Technical Verdict: HOLD (wait & see)
The technical evidence leans positive, but resistance is close and the latest session’s volume was below its 20-session average. The verdict is HOLD (wait & see): the uptrend remains intact, while a clearer signal depends on how price behaves around resistance.
- Ideal entry range: $28.41–$28.89, around the 50-day and 20-day averages; this is a reference range from the supplied technical levels, not a prediction that price will return there.
- Exit target: $30.42–$30.78, spanning 20-session resistance and the upper Bollinger band.
- Stop-loss protection: Below $27.41, the 20-session support level.
- Invalidation: The verdict is invalidated if price falls below $27.41.
For non-traders, this means the chart still favors the recent upward trend, but the shares are close to a level where a stall or breakout would clarify the next technical signal.
Disclaimer: This technical analysis is generated automatically from exchange data (via Yahoo Finance) and indicators calculated by JournalArta, for information and education only. The verdict and the entry, target and stop-loss levels are not investment advice or a solicitation to buy or sell any security. Investment decisions and their risks rest solely with the reader.