AMAT Stock Technicals: Gains 5.07% on Wednesday, Death Cross Pressure
On October 28, 2026: price 416.00 USD, trend downtrend, RSI 42.3, support 375.58, resistance 542.28. technical analysis of amat stock. AMAT Stock Technicals —…
Why AMAT is in focus today
- Fresh death cross: SMA20 crossed below SMA50
Selected automatically from 32 NASDAQ (US) stocks by a technical-signal score with daily weighted randomisation — not a recommendation.
Trend & Price Action
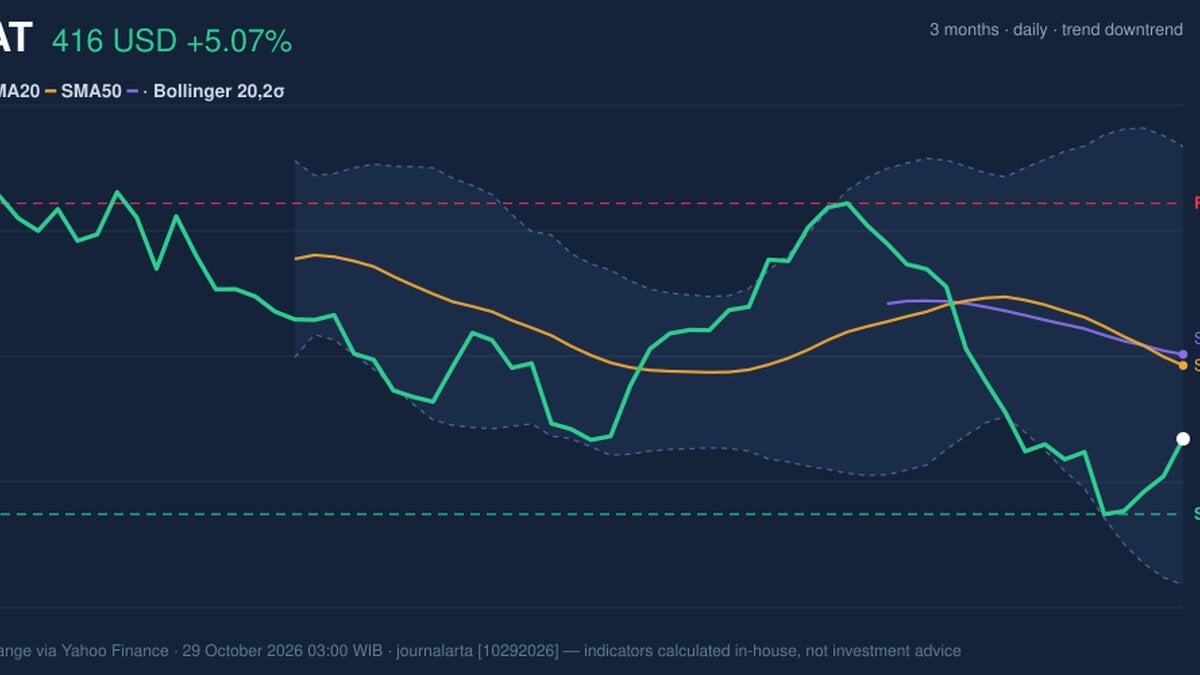
AMAT closed below both its 20-day simple moving average, or SMA20, at $455.31 and its 50-day average at $461.27. A simple moving average smooths past prices to help show the prevailing direction. The SMA20’s slope was down 5.37% over five days, reinforcing the weakness in the price trend. The death cross formed two sessions before the latest session, when the faster-moving SMA20 fell below the SMA50. It is a lagging signal, not a forecast: it reflects sustained deterioration in recent prices, while a rebound can still occur before the averages turn higher. At $416, the stock sits around 24% of its 20-day support-to-resistance range, closer to support than resistance. The 20-day support is $375.58, while resistance is $542.28. The three-month range runs from $372.80 to $563.76, placing the latest close near its lower end.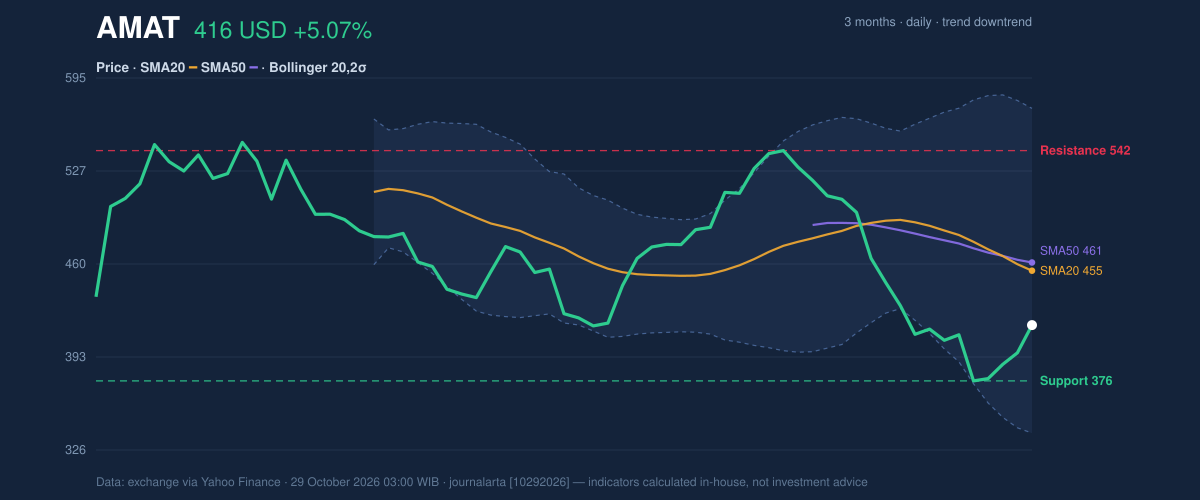
Oscillators & Momentum
Momentum indicators do not yet confirm a durable reversal. The RSI is 42.3, in neutral territory; the Relative Strength Index gauges the pace of recent gains and losses, and this reading is not low enough to show an extreme oversold condition. The Stochastic readings are also neutral, with %K at 29.4 and %D at 18.2. This indicator compares a close with the recent trading range. Its lower readings suggest weak positioning, but they do not, by themselves, establish that buyers have taken control. The MACD is negative at -24.239, below its -18.250 signal line, with a -5.988 histogram. The Moving Average Convergence Divergence indicator compares trend-following averages; here, its position points to downside momentum rather than a confirmed shift upward. As shown in the momentum chart, the combination is mixed: neutral RSI and Stochastic readings alongside a negative MACD.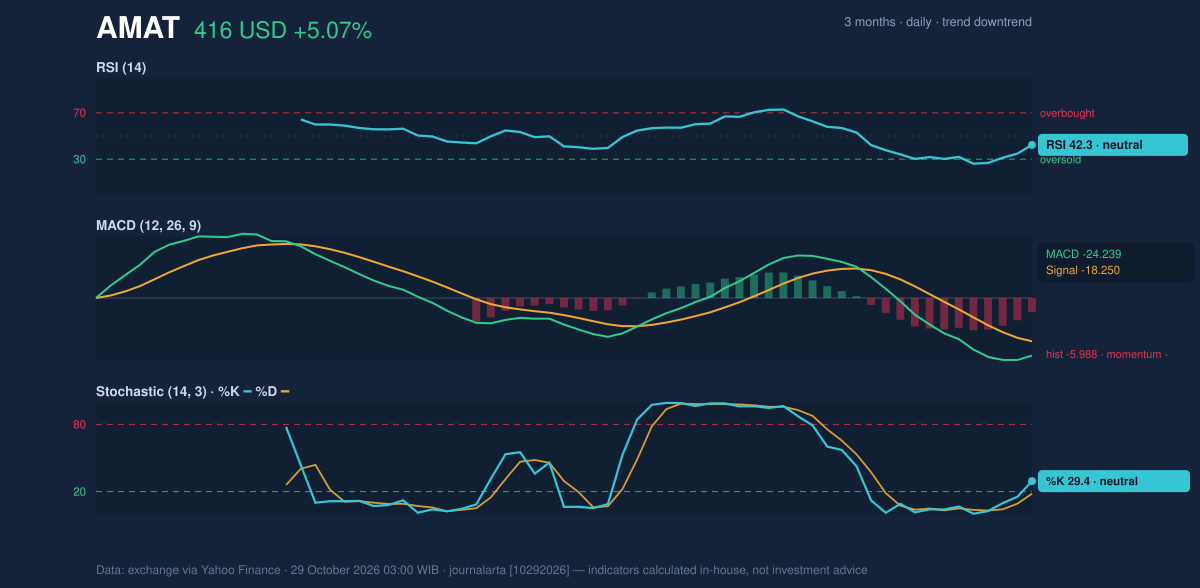
Volatility, Volume & Levels
The Bollinger bands are wide: the band width is 51.6%, and the bands are expanding, a sign of elevated volatility. AMAT’s Bollinger %B is 33%, meaning the price is in the lower portion of the band range, but not at the lower band. The lower band is $337.84, the midpoint $455.31 and the upper band $572.78. Wide bands describe larger price swings; they do not identify which direction comes next. Average True Range, a measure of typical price movement, is $20.50, or 4.9% of the share price. That elevated reading means daily moves can be substantial. Volume was 7,069,700 shares, about 1.0 times its 20-day average of 6,964,030, while On-Balance Volume was falling. The session’s gain therefore came on near-normal turnover, without volume evidence of broadening accumulation. A hold above $375.58 would preserve the current support area; a break below it would weaken the technical picture and bring the three-month low of $372.80 into focus. On the upside, a sustained move through the SMA20 at $455.31 would be an initial test of recovery, with the SMA50 at $461.27 close behind. The much higher $542.28 resistance remains a more distant hurdle.Technical Verdict: HOLD (wait & see)
The indicators support a wait-and-see reading rather than a directional signal: the death cross and negative MACD point to continuing weakness, while neutral oscillators and the latest rebound leave room for stabilization. Falling OBV and expanding Bollinger bands add uncertainty. - Ideal entry range: $375.58–$416.00, bounded by 20-day support and the latest close. - Exit target: $455.31, the SMA20 resistance level. - Stop-loss protection: $337.84, the lower Bollinger band. - Invalidation: This verdict is invalidated if price falls below $375.58, the stated 20-day support. In plain English, AMAT has rebounded, but the trend indicators have not yet shown that the decline has turned around. | Indicator | Reading | |---|---:| | Latest close | $416.00 | | Change: 1 day / 5 days / 1 month | +5.07% / +1.73% / -18.65% | | SMA20 / SMA50 | $455.31 / $461.27 | | Death cross | Formed two sessions before latest session | | RSI(14) | 42.3, neutral | | Stochastic %K / %D | 29.4 / 18.2, neutral | | MACD / signal / histogram | -24.239 / -18.250 / -5.988 | | Bollinger %B / band width | 33% / 51.6%, expanding | | ATR(14) | $20.50 (4.9%) | | Volume / 20-day average | 7,069,700 / 6,964,030 | | OBV | Falling | | 20-day support / resistance | $375.58 / $542.28 | | Three-month high / low | $563.76 / $372.80 |Summary Data AMAT
| Last price | 416.00 USD |
| Change 1 day / 5 days / 1 month | 5.07% / 1.73% / -18.65% |
| Trend / MA-cross | downtrend / death |
| SMA20 / SMA50 | 455.31 / 461.27 |
| RSI (14) / Stochastic %K | 42.3 / 29.4 |
| Bollinger %B / ATR | 33% / 20.50 |
| Support / Resistance 20 days | 375.58 / 542.28 |
| Data as of | 29 October 2026 03:00 WIB |
Disclaimer: This technical analysis is generated automatically from exchange data (via Yahoo Finance) and indicators calculated by JournalArta, for information and education only. The verdict and the entry, target and stop-loss levels are not investment advice or a solicitation to buy or sell any security. Investment decisions and their risks rest solely with the reader.
Track AMAT stock price daily: live levels, support/resistance and our full AMAT analysis history.