GOOGL Stock Analysis: Gains 1.34%, Death Cross Pressure
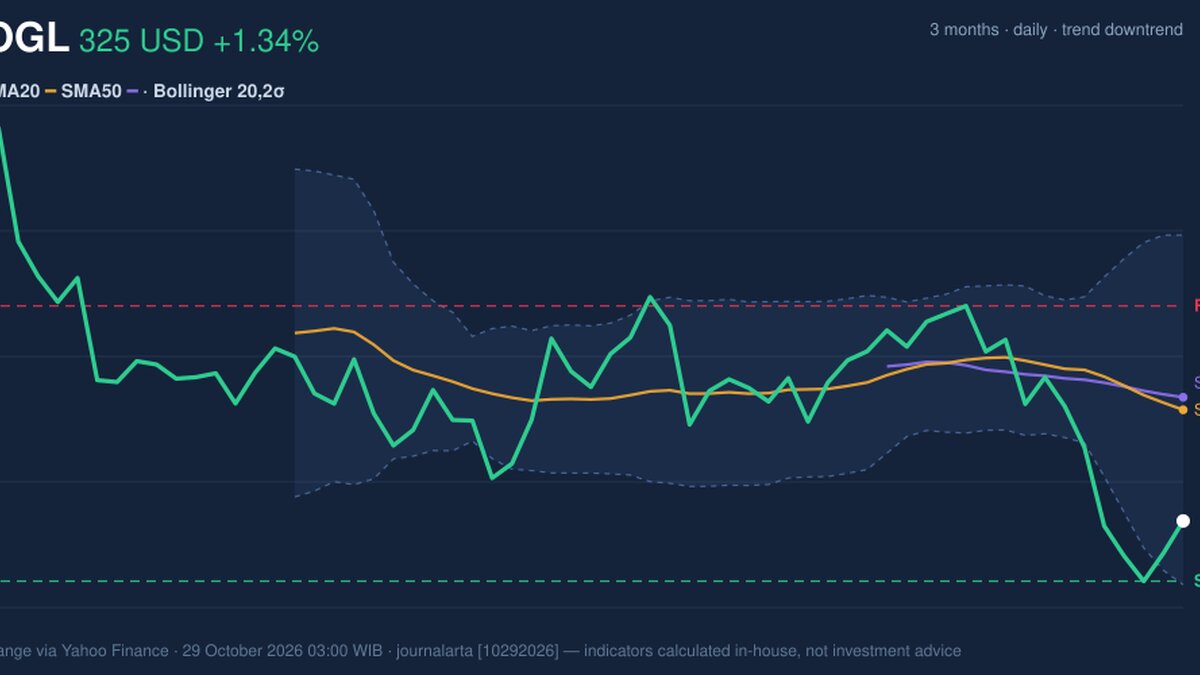
On October 28, 2026: price 324.89 USD, trend downtrend, RSI 39.0, support 316.80, resistance 353.78. technical analysis of googl stock.
Why GOOGL is in focus today
- Volume at 2.4× the 20-day average
- Fresh death cross: SMA20 crossed below SMA50
- Downtrend extending (5-day change -2.95%)
Selected automatically from 32 NASDAQ (US) stocks by a technical-signal score with daily weighted randomisation — not a recommendation.
Trend & Price Action
GOOGL closed below both its 20-day simple moving average (SMA), at $339.81, and its 50-day average, at $341.51. The shorter average slopes down 1.55% over five days, and a death cross formed two sessions before the latest session: the 20-day average moved below the 50-day average. This pattern signals weakening trend structure, not a guarantee of further declines. The price is also near the bottom of its recent range. At $324.89, it sits 22% of the way from the 20-day support of $316.80 to resistance at $353.78. Its three-month low is $316.60, close to that support, while the three-month high is $384.48. The proximity to the low makes support a key test; the distance from the moving averages shows that a one-day gain has not yet repaired the trend.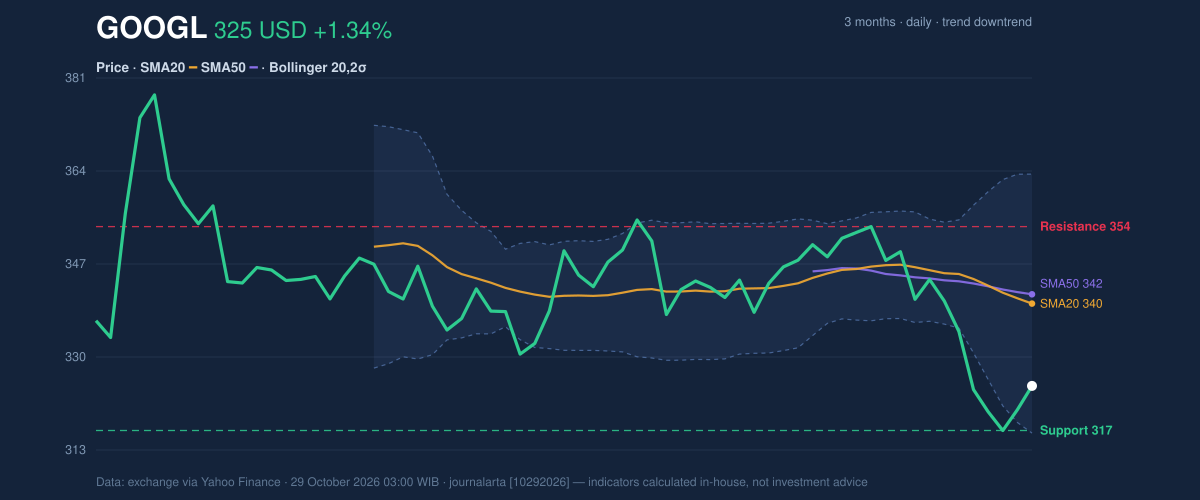
Oscillators & Momentum
The indicators are mixed but lean negative. The RSI is 39.0, in neutral territory, below the level typically associated with stronger upward momentum but not signaling an extreme by itself. The Stochastic is oversold, with %K at 19.4 and %D at 9.7; readings in this area can occur when declines have been sharp, but they do not establish that a rebound has begun. The MACD remains negative at -6.006, below its -3.110 signal line, with a -2.896 histogram. In plain terms, the short-term momentum measure is still weaker than its comparison line. That leaves the oversold Stochastic as a possible sign of selling exhaustion, not confirmation of a trend reversal.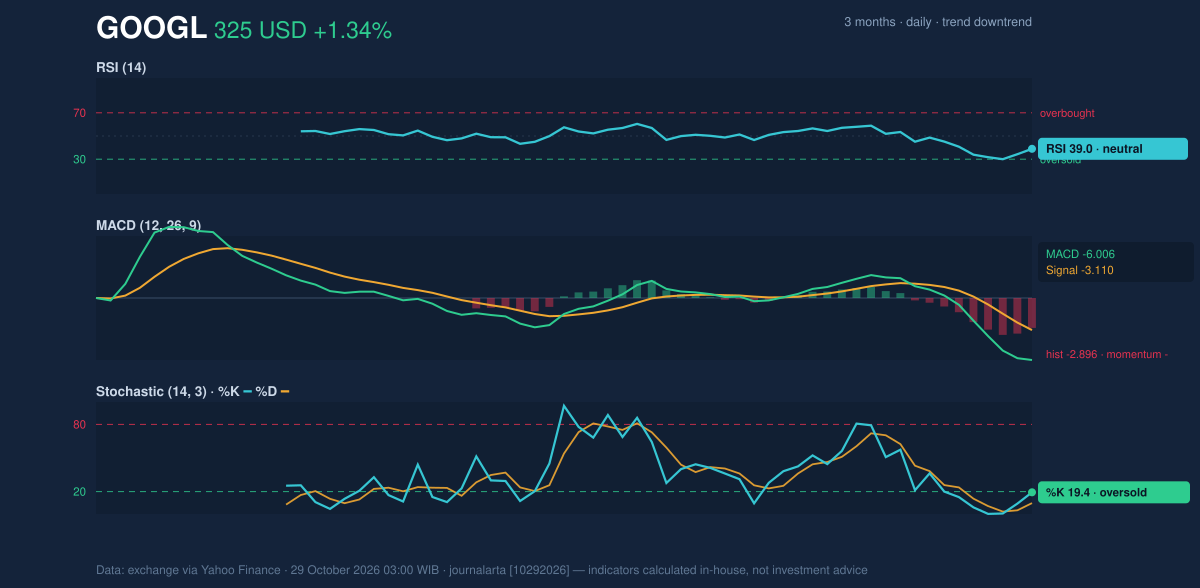
Volatility & Key Levels
The Bollinger band measure places the price near the lower end of its range: %B is 18%, with the lower band at $316.34 and the upper band at $363.28. The bands are at normal width, not compressed into a squeeze, so the data do not point to an unusually quiet market poised for a large move. The average true range (ATR) is $8.06, or 2.5% of the share price, indicating moderate daily volatility. The key near-term test is whether GOOGL holds the $316.80 support area, near both the lower Bollinger band and the three-month low. A break below that zone would weaken the technical picture further. On the upside, recovery above the $339.81–$341.51 moving-average area would be an initial sign that selling pressure is easing; $353.78 is the next stated resistance. Neither level has been reclaimed.Technical Verdict: HOLD (wait & see)
The technical balance remains cautious: the death cross and falling 20-day average show a weakening trend; negative MACD and declining OBV lack confirmation of a durable reversal; and the oversold Stochastic offers only a counter-signal. The verdict is invalidated if price falls below the $316.80 support level. - Ideal Entry Range: $316.80–$339.81, bounded by 20-day support and the 20-day average. - Exit Target (Target Price): $353.78, the stated 20-day resistance. - Stop Loss: Below $316.34, the lower Bollinger band. For non-traders, HOLD means the indicators show a possible bounce but not enough evidence that the broader downward trend has turned.Summary Data GOOGL
| Last price | 324.89 USD |
| Change 1 day / 5 days / 1 month | 1.34% / -2.95% / -5.58% |
| Trend / MA-cross | downtrend / death |
| SMA20 / SMA50 | 339.81 / 341.51 |
| RSI (14) / Stochastic %K | 39.0 / 19.4 |
| Bollinger %B / ATR | 18% / 8.06 |
| Support / Resistance 20 days | 316.80 / 353.78 |
| Data as of | 29 October 2026 03:00 WIB |
Disclaimer: This technical analysis is generated automatically from exchange data (via Yahoo Finance) and indicators calculated by JournalArta, for information and education only. The verdict and the entry, target and stop-loss levels are not investment advice or a solicitation to buy or sell any security. Investment decisions and their risks rest solely with the reader.
Track GOOGL stock price daily: live levels, support/resistance and our full GOOGL analysis history.