HKEX Stock Analysis: Drops 0.71%, Testing Support Level
On October 28, 2026: price 365.00 HKD, trend downtrend, RSI 33.5, support 365.00, resistance 387.80. technical analysis of hkex stock. HKEX Stock Analysis —…
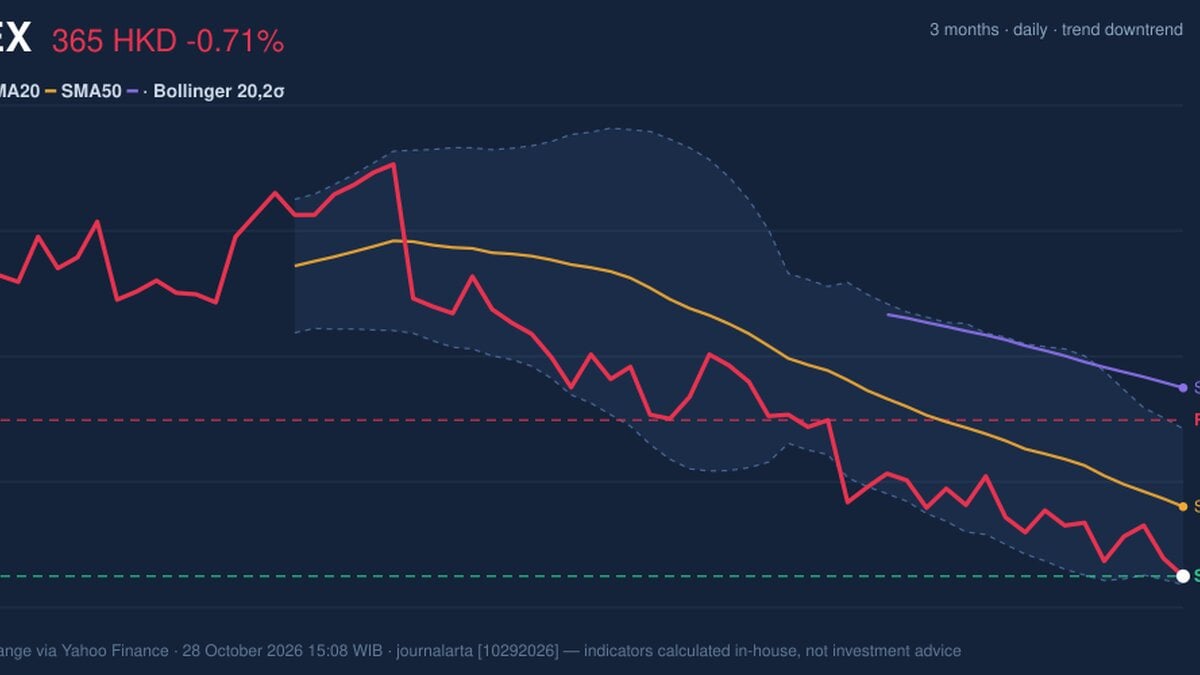
Why HKEX is in focus today
- Closed at a 20-day low (365.00)
- Trading near its 3-month low (364.00)
- Downtrend extending (5-day change -2.09%)
Selected automatically from 16 HKEX (Hong Kong) stocks by a technical-signal score with daily weighted randomisation — not a recommendation.
Trend & Price Action
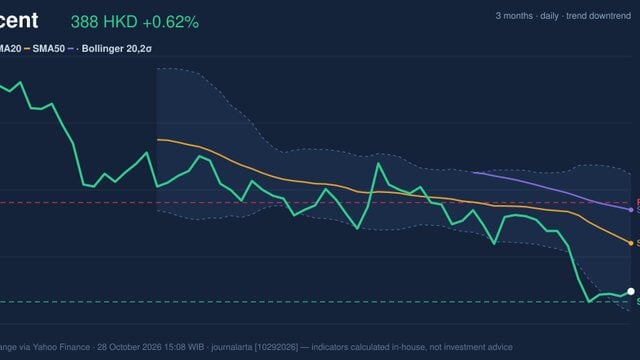
The shares sit below both the 20-day simple moving average (SMA20, the average closing price over the last 20 sessions) at 375.15 and the 50-day average at 392.51. When price trails both, and the longer average sits well above the shorter one, sellers have controlled the direction for some time. The 20-day average itself fell 1.58% over five days, confirming that the slope is still pointing down. No new moving-average crossover has formed, so the downtrend is an established condition, not a fresh signal. Position within the range is telling. The 20-day support sits at 365.00, exactly where the stock closed, which places it at 0% of its 20-day range. The 20-day resistance is at 387.80, and the three-month high of 426.00 is far overhead. As shown in the chart, price is pressed against the lower Bollinger band while the averages slope down above it.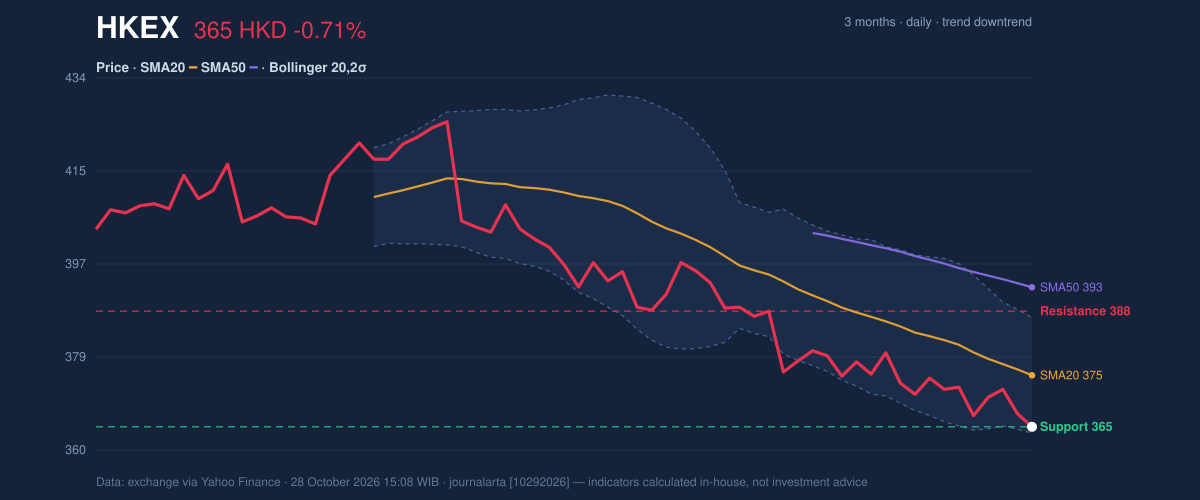
Oscillators & Momentum
Momentum gauges paint a more nuanced picture than the price decline alone. The Relative Strength Index (RSI), which measures the speed of recent gains versus losses on a 0–100 scale, reads 33.5. That is classified as neutral, though it is closer to the oversold zone than to the middle. The Stochastic oscillator, which compares the close with the recent trading range, is more extreme: %K at 5.8 and %D at 22.9, both in oversold territory. Oversold means the stock has fallen quickly relative to its recent range; it does not mean a rebound is due. The MACD (a gauge comparing short- and long-term price averages) is at -6.666 against a signal line of -6.674. The histogram is a barely positive 0.007. In plain terms, downward momentum has stopped accelerating, but the line remains deeply negative and no real upturn has begun. The chart's lower panel shows the three indicators side by side.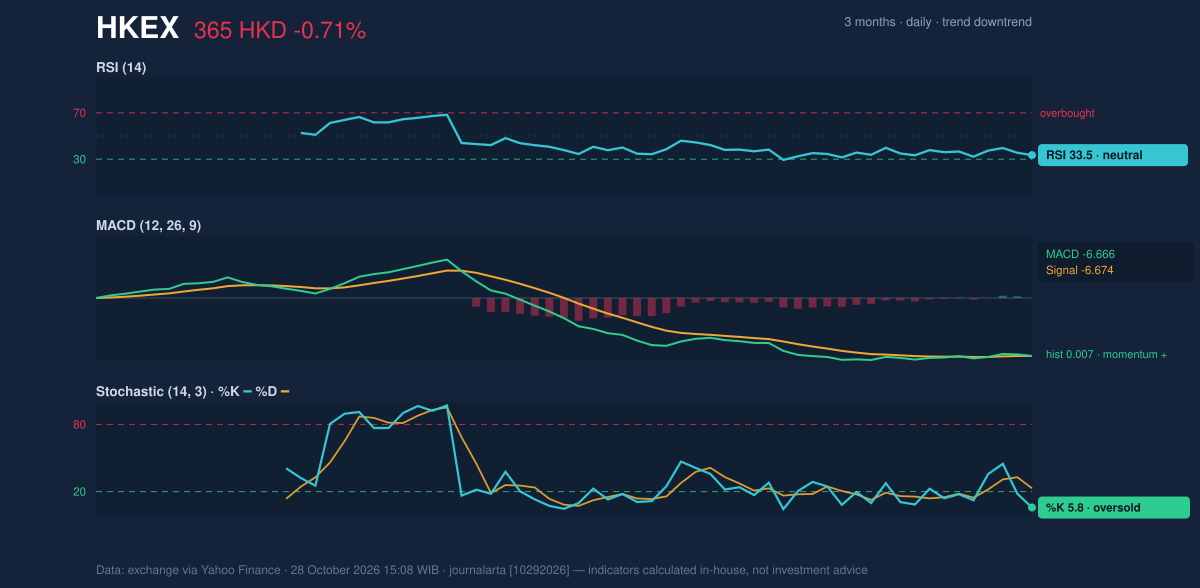
Volatility & Volume
363.76. Price sits at a %B of 5%, meaning it is almost on the lower edge. A narrowing channel, often called a squeeze, tends to precede a larger move, though it does not reveal the direction. The Average True Range (ATR), a measure of typical daily movement, is 5.83, or 1.6% of the price, a moderate level. Participation offers little reassurance. Volume of 3,074,253 shares was about 1.0 times the 20-day average of 3,063,936, so the decline came on ordinary, not panicked, trading. Meanwhile on-balance volume (OBV), which tallies volume on up days versus down days, is falling, a sign that selling pressure still outweighs buying.Key Levels & Scenarios
The immediate line is the 364.00 three-month low, one HKD below the close and virtually the same as the lower Bollinger band at 363.76. A close beneath that zone would take the stock into a range it has not visited in three months. If it holds, the first hurdle is the SMA20 at 375.15, followed by the 20-day resistance at 387.80.Technical Verdict: HOLD (wait & see)
The indicators conflict, which argues for patience: - Trend: price below SMA20 and SMA50, with a falling 20-day average, favors the downside. - Oscillators: Stochastic at 5.8 and a MACD histogram turning marginally positive hint at fading selling pressure. - Volume: falling OBV and average volume do not confirm a reversal. Reference levels from the data: - Entry range: 363.76–365.00, the support and lower-band zone, only if it holds. - Exit target: 375.15 (SMA20) first, then 387.80 (20-day resistance). - Stop loss: below 363.76, near the three-month low of 364.00. The verdict is invalidated if price closes below 363.76, which would confirm a break lower. This is technical analysis, not an investment recommendation. In plain terms: HKEX is near the bottom of its recent range, but the evidence is not strong enough to say the slide has ended.| Indicator | Value |
|---|---|
| Last price | 365.00 HKD |
| SMA20 / SMA50 | 375.15 / 392.51 |
| Bollinger (upper / middle / lower) | 386.54 / 375.15 / 363.76 |
| %B / band width | 5% / 6.1% |
| RSI(14) | 33.5 |
| Stochastic %K / %D | 5.8 / 22.9 |
| MACD / signal / histogram | -6.666 / -6.674 / 0.007 |
| ATR(14) | 5.83 (1.6%) |
| Support / resistance (20 days) | 365.00 / 387.80 |
| 3-month high / low | 426.00 / 364.00 |
Summary Data HKEX
| Last price | 365.00 HKD |
| Change 1 day / 5 days / 1 month | -0.71% / -2.09% / -6.07% |
| Trend / MA-cross | downtrend / none |
| SMA20 / SMA50 | 375.15 / 392.51 |
| RSI (14) / Stochastic %K | 33.5 / 5.8 |
| Bollinger %B / ATR | 5% / 5.83 |
| Support / Resistance 20 days | 365.00 / 387.80 |
| Data as of | 28 October 2026 15:08 WIB |
Disclaimer: This technical analysis is generated automatically from exchange data (via Yahoo Finance) and indicators calculated by JournalArta, for information and education only. The verdict and the entry, target and stop-loss levels are not investment advice or a solicitation to buy or sell any security. Investment decisions and their risks rest solely with the reader.
Track HKEX share price daily: live levels, support/resistance and our full HKEX analysis history.