ADI Stock Technicals: Drops 3.73% on Friday, Momentum Gains
On October 30, 2026: price 417.11 USD, trend uptrend, RSI 56.6, support 385.76, resistance 433.28. technical analysis of adi stock. ADI Stock Technicals — full…

Why ADI is in focus today
- Volume at 2.2× the 20-day average
- Uptrend confirmed (5-day change 6.66%)
- Not covered by JournalArta in the last 14 days
Selected automatically from 100 NASDAQ (US) stocks by a technical-signal score with daily weighted randomisation — not a recommendation.
Trend & Price Action
ADI’s price remains above its 20-day average of $408.59 and 50-day average of $388.54. The 20-day average itself rose 1.24% over five days, indicating that short-term trend support is improving rather than simply reflecting a one-session jump. No new moving-average crossover formed in the latest session, so the trend case rests on price holding above those averages—not on a fresh technical signal. The $417.11 close stood about two-thirds of the way through the 20-day range, between support at $385.76 and resistance at $433.28. The top of the Bollinger band, a measure of how far price has moved from its recent average, is $433.30, close to that resistance. The band width is 12.1%, a normal reading rather than a squeeze that might suggest unusually compressed trading. Price above rising averages supports the uptrend, but resistance near $433 is a clear test.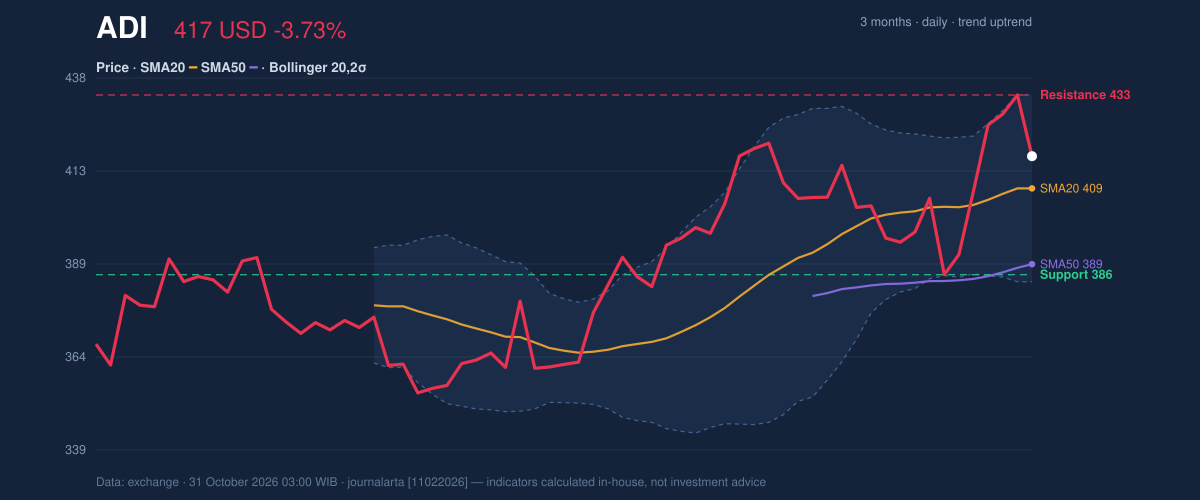
Oscillators & Momentum
The momentum indicators are constructive but not uniformly strong. The MACD histogram, which tracks the relationship between two moving averages to show whether momentum is strengthening or weakening, is positive at 1.598; MACD is 8.004 against a 6.406 signal line. The computed technical assessment flags the histogram’s turn positive as a bullish signal. RSI, a measure of the speed and size of recent price moves, is 56.6—neutral rather than overbought. Stochastic readings are also classified as neutral, with %K at 68.3 and %D at 88.4. The data’s bearish caution is that RSI has rolled over from above 65. In other words, momentum remains positive by MACD, but the retreat in RSI warns that the recent advance may be losing some force. The indicators lean upward, yet they do not confirm an uninterrupted push higher.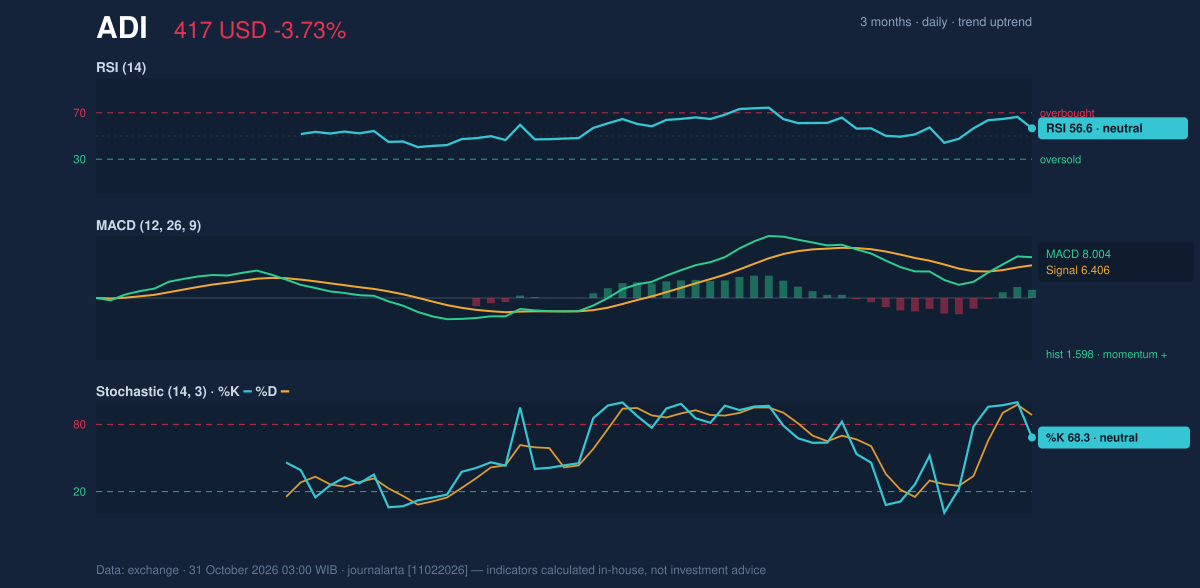
Volatility & Volume
Turnover reached 7,877,200 shares against a 20-day average of 3,656,540, or 2.2 times normal. On its own, a volume spike does not establish whether buyers or sellers will control the next move. Here, however, the on-balance volume measure (OBV), which adds volume on rising sessions and subtracts it on falling ones, is rising. That supports the view that participation has improved alongside the broader uptrend, even as the latest session brought a sharp setback. Volatility is elevated: the 14-day average true range, which estimates typical daily price movement, is $15.78, or 3.8% of the share price. That makes moves toward nearby support or resistance more plausible than they would be in a calmer stock. The Bollinger %B reading of 67% places price in the upper portion of its band range, but not at the upper boundary.Key Levels & Scenarios
Resistance is at $433.28, with the three-month high at $433.39. A move above that area would put the next stated reference level at $440.78, the price-plus-1.5-times-ATR measure. If the shares instead retreat, the 20-day average at $408.59 is an initial trend reference; the 20-day support at $385.76 is the more consequential level. The price-minus-1.5-times-ATR reference is $393.44, between those two levels. A break above $433.39 would clear the recent range ceiling; a fall below $385.76 would undermine the current uptrend case. The three-month low of $348.00 marks a deeper historical boundary, but the nearer support and volatility-based references are more relevant to the present setup.Technical Verdict: BUY
The technical bias is bullish, supported by the positive MACD histogram, price above the 50-day average after a pullback toward the 20-day average, and rising OBV. The principal caution is RSI’s rollover from above 65, alongside a high-volume down session. The verdict is invalidated if price breaks below the $385.76 20-day support. - Ideal entry range: $408.59–$417.11, bounded by the 20-day average and latest close. - Exit target: $433.28, the 20-day resistance. - Stop-loss protection: $385.76, below the 20-day support. For non-traders, the signals favor the existing upward trend, but a drop through support would call that reading into question.Data
ADI, NASDAQ; latest session: Friday, October 30, 2026. Last price: $417.11; previous close: $433.28. Change: 1 day −3.73%, 5 days +6.66%, 1 month −0.01%. SMA20: $408.59; SMA50: $388.54; Bollinger bands: upper $433.30, middle $408.59, lower $383.88; RSI(14): 56.6; Stochastic %K/%D: 68.3/88.4; MACD/signal/histogram: 8.004/6.406/1.598. Volume: 7,877,200; 20-day average: 3,656,540; OBV: rising. Support: $385.76; resistance: $433.28; three-month high/low: $433.39/$348.00.Summary Data ADI
| Last price | 417.11 USD |
| Change 1 day / 5 days / 1 month | -3.73% / 6.66% / -0.01% |
| Trend / MA-cross | uptrend / none |
| SMA20 / SMA50 | 408.59 / 388.54 |
| RSI (14) / Stochastic %K | 56.6 / 68.3 |
| Bollinger %B / ATR | 67% / 15.78 |
| Support / Resistance 20 days | 385.76 / 433.28 |
| Data as of | 31 October 2026 03:00 WIB |
Disclaimer: This technical analysis is generated automatically from exchange data and indicators calculated by JournalArta, for information and education only. The verdict and the entry, target and stop-loss levels are not investment advice or a solicitation to buy or sell any security. Investment decisions and their risks rest solely with the reader.
Track ADI stock price daily: live levels, support/resistance and our full ADI analysis history.