Momentum Gains, IDXX Stock Drops 4.30% on Friday
On October 30, 2026: price 551.21 USD, trend uptrend, RSI 52.4, support 506.67, resistance 575.98. technical analysis of idxx stock. Momentum Gains — full…

Why IDXX is in focus today
- One-day move of -4.30%, about 1.5× its average daily range (ATR)
- Volume at 2.1× the 20-day average
- Not covered by JournalArta in the last 14 days
Selected automatically from 100 NASDAQ (US) stocks by a technical-signal score with daily weighted randomisation — not a recommendation.
Trend & Price Action
IDXX’s one-day drop contrasted with gains of 6.33% over one month, though the stock was down 1.64% over five days. It closed above the 20-day simple moving average, or SMA, at $543.85 and the 50-day average at $534.27. The 20-day average rose 1.88% over five days, a sign that the shorter-term trend remains upward even as the latest session tested that strength. No new moving-average crossover formed in the latest session. That matters because a crossover can signal a change in trend; without one, the sharp decline is not, by itself, confirmation that the broader uptrend has reversed. The price is at 64% of its 20-day range, between support at $506.67 and resistance at $575.98, and remains within its three-month range of $500.61 to $624.15. The pullback toward the rising 20-day average is a bullish signal, but not enough to outweigh the mixed evidence. The close remains above that average, while the heavy volume and falling On-Balance Volume (OBV)—a measure of whether volume is accumulating on rising or falling sessions—suggest selling participation deserves attention.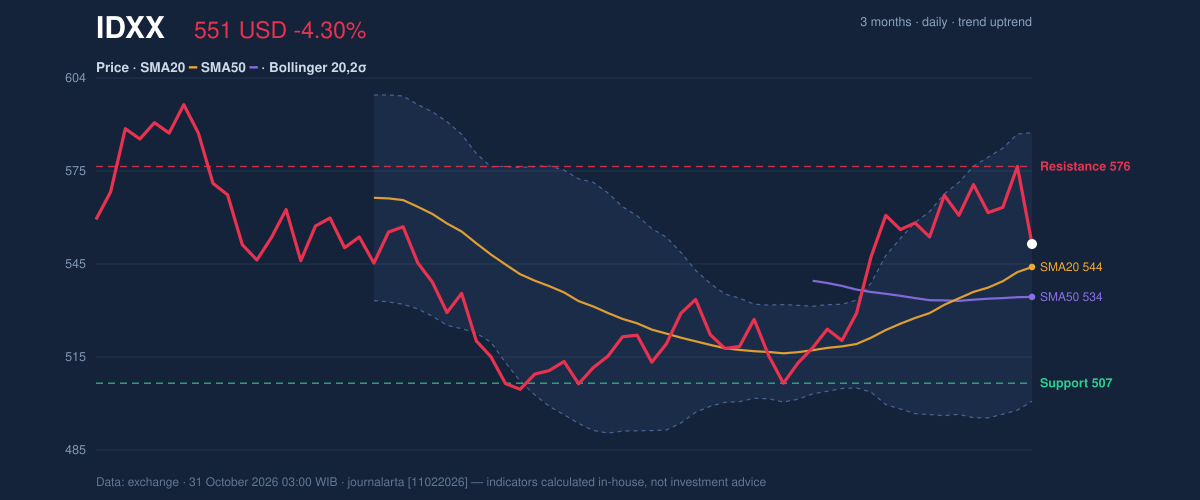
Oscillators & Momentum
Momentum indicators do not point to a decisive break in either direction. The Relative Strength Index (RSI), which gauges the pace of recent price moves, stands at 52.4, in neutral territory. The technical reading also flags RSI as rolling over from above 65, a bearish caution: momentum has cooled, even though the current RSI is not at an extreme. The Stochastic readings are likewise classified as neutral, with %K at 51.2 and %D at 78.6. The gap between the two lines is a reason to watch for continued loss of short-term momentum, rather than evidence on its own of a confirmed reversal. By contrast, MACD remains positive: its reading of 10.100 is above the 8.405 signal line, with a positive histogram of 1.695. That supports the view that the underlying trend has not yet turned decisively lower.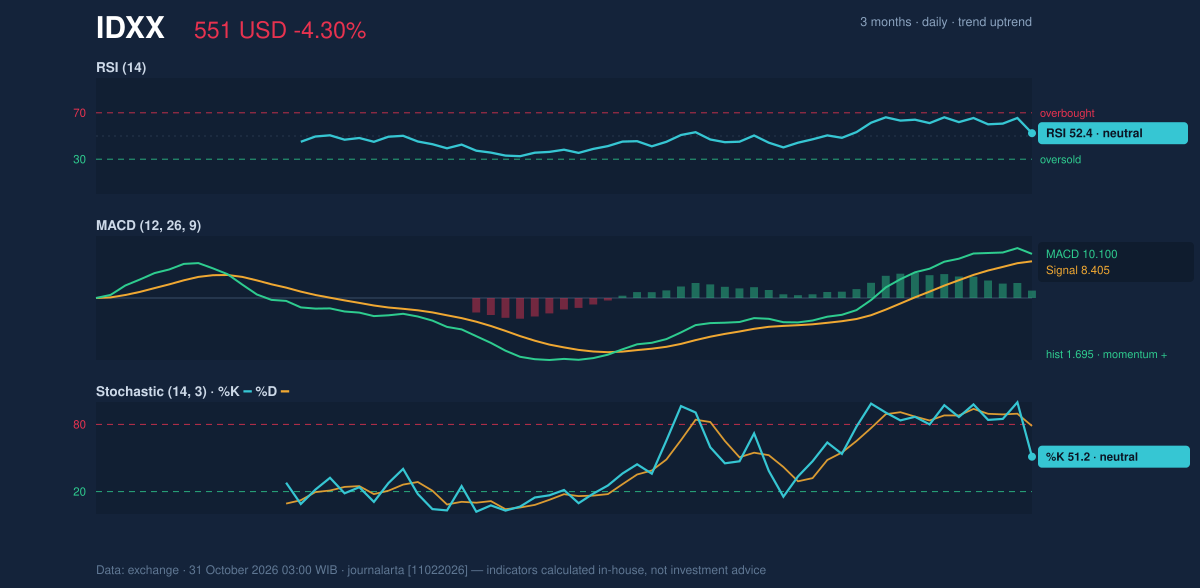
Volatility, Volume & Key Levels
The latest volume of 1,173,500 shares was 2.1 times the 20-day average of 562,000. High turnover makes the drop harder to dismiss as a low-participation fluctuation, though the decline in OBV adds no confirmation that buyers are absorbing the selling. Bollinger Bands, which frame price relative to its recent volatility, show a normal width of 15.8%. IDXX’s position at 59% of the band leaves it away from both the upper boundary at $586.79 and the lower boundary at $500.91. The ATR of $15.57, or 2.8% of the price, indicates moderate volatility; it measures typical movement, not a forecast of the next session. Support is $506.67, while resistance is $575.98. A hold above the $543.85 20-day average would keep the pullback consistent with an intact uptrend. A move back through resistance would put the three-month high of $624.15 in view as the next reference level; a fall below support would weaken the current trend structure.Technical Verdict: HOLD
The technical bias is neutral, so the verdict is HOLD (wait & see). The strongest reasons are the positive MACD and price above both moving averages on one side, countered by the RSI rolling over from above 65, unusually high selling-session volume and declining OBV. The verdict is invalidated if price falls below the $506.67 20-day support.- Indicative entry range: $543.85–$551.21, around the 20-day average and latest closing price.
- Reference exit target: $575.98, the 20-day resistance.
- Stop-loss protection reference: $506.67, the 20-day support.
| Data point | Reading |
|---|---|
| Latest close | $551.21 |
| Change | -4.30% (1 day); -1.64% (5 days); +6.33% (1 month) |
| SMA20 / SMA50 | $543.85 / $534.27 |
| RSI / Stochastic | 52.4 / %K 51.2, %D 78.6 |
| MACD / signal / histogram | 10.100 / 8.405 / 1.695 |
| Support / resistance | $506.67 / $575.98 |
| Volume / 20-day average | 1,173,500 / 562,000 |
Summary Data IDXX
| Last price | 551.21 USD |
| Change 1 day / 5 days / 1 month | -4.30% / -1.64% / 6.33% |
| Trend / MA-cross | uptrend / none |
| SMA20 / SMA50 | 543.85 / 534.27 |
| RSI (14) / Stochastic %K | 52.4 / 51.2 |
| Bollinger %B / ATR | 59% / 15.57 |
| Support / Resistance 20 days | 506.67 / 575.98 |
| Data as of | 31 October 2026 03:00 WIB |
Disclaimer: This technical analysis is generated automatically from exchange data and indicators calculated by JournalArta, for information and education only. The verdict and the entry, target and stop-loss levels are not investment advice or a solicitation to buy or sell any security. Investment decisions and their risks rest solely with the reader.
Track IDXX stock price daily: live levels, support/resistance and our full IDXX analysis history.