APP Stock Drops 10.36% on Friday, RSI Oversold
On October 30, 2026: price 228.50 USD, trend downtrend, RSI 24.9, support 228.50, resistance 281.97. technical analysis of app stock. APP Stock Drops — full…

Why APP is in focus today
- One-day move of -10.36%, about 2.1× its average daily range (ATR)
- Volume at 2.4× the 20-day average
- Closed at a 20-day low (228.50)
- Trading near its 3-month low (225.19)
- RSI(14) at 24.9 — oversold zone
- MACD histogram has just turned negative
- Downtrend extending (5-day change -12.20%)
- Not covered by JournalArta in the last 14 days
Selected automatically from 100 NASDAQ (US) stocks by a technical-signal score with daily weighted randomisation — not a recommendation.
Trend & Price Action
AppLovin closed below its 20-day moving average of $267.55 and its 50-day average of $294.20. The 20-day average itself fell 3.38% over five days, confirming that the short-term trend is weakening rather than merely reflecting a single bad session. No new moving-average crossover was recorded. The close sat at the bottom of the 20-day trading range, with support at $228.50. The three-month low of $225.19 is only modestly below that level. Together, those prices identify a nearby test: a hold could mark an attempt to stabilize, while a break would put the shares below both the recorded 20-day support and close to the three-month trough. As shown in the chart, the Bollinger middle band coincides with the 20-day average, while the lower band is at $243.57—above the latest close. Bollinger Bands measure how far a price has moved from its recent average. A negative %B reading of -31% places the price below the lower band, an unusually weak position that can accompany intense selling, but is not by itself proof of a rebound. The band width of 17.9% is described as normal, so the data do not show an unusually compressed range before the move.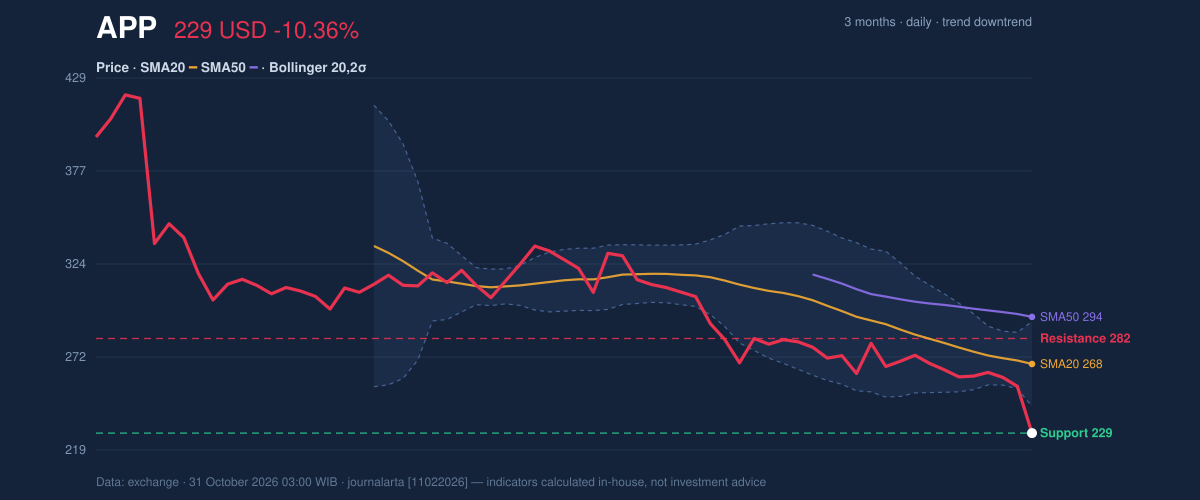
Oscillators & Momentum
The RSI, a measure of recent price strength, stood at 24.9, in oversold territory. The Stochastic readings were also oversold, with %K at 6.0 and %D at 10.4. These levels say that the decline has been steep relative to recent trading; they do not establish that sellers have finished. The MACD, a trend-and-momentum indicator, was negative at -13.906, below its -12.524 signal line. Its histogram, which tracks the gap between those readings, was -1.381 and had just turned negative. That shift adds evidence of deteriorating momentum rather than confirming a reversal. The RSI and Stochastic readings therefore conflict with the trend indicators only in the sense that they flag an extended decline—not in showing that the broader direction has changed.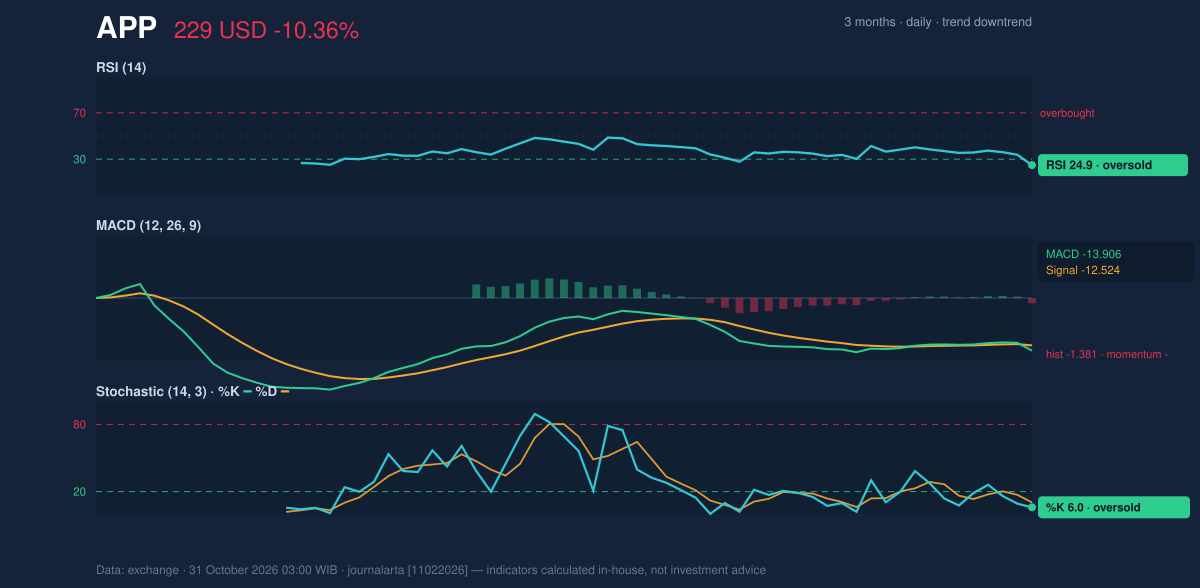
Volatility, Volume & Key Levels
The 14-day ATR, a measure of typical price movement, was $11.37, or 5.0% of the share price. That marks elevated volatility: moves around the current level may be large enough to test nearby reference prices quickly. On the volume side, falling OBV—a running measure that uses trading volume to track buying and selling pressure—supports the bearish reading. It suggests that the high-volume decline was not accompanied by accumulating demand. The nearest reference points are $228.50 support and the $225.19 three-month low. If price falls below the three-month low, the supplied data identify $211.44, calculated as 1.5 times ATR below the latest price, as a further volatility-based reference—not a guaranteed floor. A recovery would first need to contend with the lower Bollinger Band at $243.57, then the $267.55 20-day average and $281.97 resistance.Technical Verdict: SELL
The bearish verdict matches the data’s technical bias. Three signals support it: the close broke the 20-day low on volume at least 1.5 times its average; the MACD histogram had just turned negative; and OBV was falling. Oversold RSI and Stochastic readings raise the possibility of a short-lived bounce, but do not negate those trend and volume signals. - Ideal entry range: $228.50–$243.57, spanning the 20-day support and lower Bollinger Band. - Exit target: $225.19, the three-month low and next downside reference. - Stop-loss protection: $281.97, above the 20-day resistance; the volatility reference at $245.56 is 1.5 times ATR above the latest price. - Invalidation: The bearish verdict is invalidated if price breaks above $281.97. For non-traders, the indicators show a strong downward trend despite signs that the shares are oversold. | Indicator | Reading | |---|---:| | Last price | $228.50 | | One-day / five-day / one-month change | -10.36% / -12.20% / -14.81% | | SMA20 / SMA50 | $267.55 / $294.20 | | RSI(14) | 24.9 | | Stochastic %K / %D | 6.0 / 10.4 | | MACD / signal / histogram | -13.906 / -12.524 / -1.381 | | ATR(14) | $11.37 | | Volume / 20-day average | 9,127,000 / 3,851,555 | | 20-day support / resistance | $228.50 / $281.97 | | Three-month low / high | $225.19 / $437.79 |Summary Data APP
| Last price | 228.50 USD |
| Change 1 day / 5 days / 1 month | -10.36% / -12.20% / -14.81% |
| Trend / MA-cross | downtrend / none |
| SMA20 / SMA50 | 267.55 / 294.20 |
| RSI (14) / Stochastic %K | 24.9 / 6.0 |
| Bollinger %B / ATR | -31% / 11.37 |
| Support / Resistance 20 days | 228.50 / 281.97 |
| Data as of | 31 October 2026 03:00 WIB |
Disclaimer: This technical analysis is generated automatically from exchange data and indicators calculated by JournalArta, for information and education only. The verdict and the entry, target and stop-loss levels are not investment advice or a solicitation to buy or sell any security. Investment decisions and their risks rest solely with the reader.
Track APP stock price daily: live levels, support/resistance and our full APP analysis history.