ORLY Stock Gains 0.06%, Golden Cross Formed In Focus
On October 30, 2026: price 88.12 USD, trend uptrend, RSI 49.9, support 83.90, resistance 92.00. technical analysis of orly stock. ORLY Stock Gains — full…
Why ORLY is in focus today
- Volume at 1.7× the 20-day average
- Fresh golden cross: SMA20 crossed above SMA50
- MACD histogram has just turned negative
- Not covered by JournalArta in the last 14 days
Selected automatically from 100 NASDAQ (US) stocks by a technical-signal score with daily weighted randomisation — not a recommendation.
Trend & Price Action
ORLY closed just above its 20-day moving average of $88.05 and above its 50-day average of $87.20. The 20-day average rose 1.12% over five days, a sign that the short-term trend is still rising. Four sessions before the latest session, the 20-day average crossed above the 50-day average, forming a golden cross. This often signals improving trend structure, but it is a lagging indicator: it confirms a shift that has already begun rather than guaranteeing further gains. The stock sits at 52% of its 20-day range, between support at $83.90 and resistance at $92.00. That position is near the middle, not at a breakout point. The three-month high is $94.12 and the low is $82.83, giving investors a wider view of the recent boundaries. As shown in the chart, price is near the middle Bollinger band, with the upper band at $92.45 and lower band at $83.64.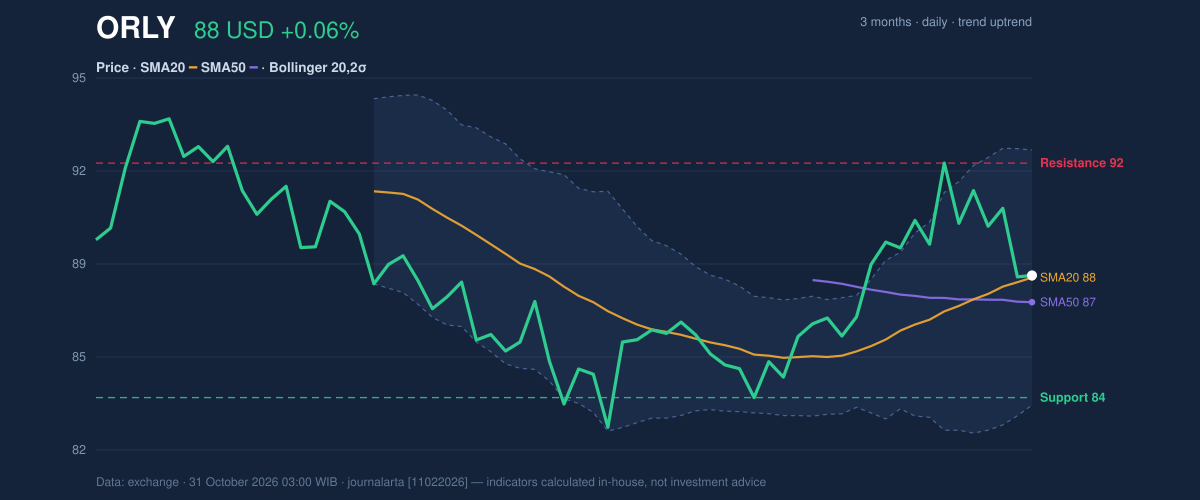
Oscillators & Momentum
The momentum indicators do not yet confirm a strong directional move. The RSI is 49.9, a neutral reading, while the Stochastic readings—%K at 33.3 and %D at 47.1—are also neutral. Neither points to an extreme overbought or oversold condition. The caution comes from MACD. Its line is at 0.787, just below the 0.799 signal line, leaving a negative histogram of -0.012. The histogram measures the gap between those lines; its turn below zero indicates that upward momentum has weakened, even though the broader trend remains positive. It is a warning, not by itself proof of a reversal.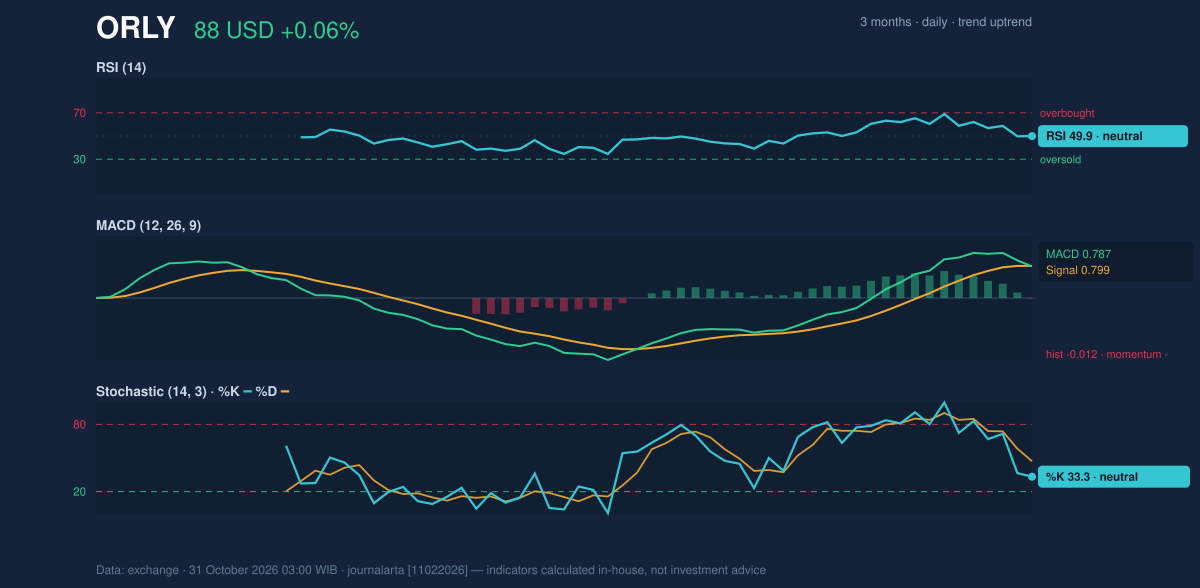
Volatility & Volume
Bollinger band width is 10.0%, described as normal, and the price is at 51% of the band range. That middle-of-band position suggests neither a pronounced stretch nor a compressed setup. The average true range, or ATR, is $2.21—about 2.5% of the share price—indicating moderate typical price movement, not a forecast of where the stock will go. Volume was 10,386,500 shares, or 1.7 times the 20-day average of 6,050,300. Higher volume means more trading participation, but its significance depends on direction: the session’s price gain was only 0.06%, so the surge does not yet establish a decisive breakout. Rising OBV, a measure that accumulates volume on advancing sessions and subtracts it on declines, provides a more constructive sign that buying participation has been building.Key Levels & Scenarios
A move through $92.00 resistance would put the three-month high at $94.12 in focus. The upper Bollinger band at $92.45 also lies near the first resistance, making that zone a meaningful test rather than an isolated line. Failure to hold the 20-day average at $88.05 would weaken the near-term picture; support at $83.90 is the more important downside reference, with the three-month low at $82.83 below it.Technical Verdict: BUY
The bullish technical bias rests on the golden cross formed four sessions before the latest session, price holding above both moving averages, and rising OBV. The counterweight is the MACD histogram at -0.012, which shows momentum has turned negative; neutral RSI and Stochastic readings offer no strong confirmation either way.- Ideal entry range: $87.20–$88.05, using the 50-day and 20-day moving averages as reference points.
- Exit target: $92.00, the next 20-day resistance.
- Stop-loss protection: $83.90, the 20-day support; a break below it invalidates the bullish verdict.
Summary Data ORLY
| Last price | 88.12 USD |
| Change 1 day / 5 days / 1 month | 0.06% / -2.00% / 3.79% |
| Trend / MA-cross | uptrend / golden |
| SMA20 / SMA50 | 88.05 / 87.20 |
| RSI (14) / Stochastic %K | 49.9 / 33.3 |
| Bollinger %B / ATR | 51% / 2.21 |
| Support / Resistance 20 days | 83.90 / 92.00 |
| Data as of | 31 October 2026 03:00 WIB |
Disclaimer: This technical analysis is generated automatically from exchange data and indicators calculated by JournalArta, for information and education only. The verdict and the entry, target and stop-loss levels are not investment advice or a solicitation to buy or sell any security. Investment decisions and their risks rest solely with the reader.
Track ORLY stock price daily: live levels, support/resistance and our full ORLY analysis history.