RSI Overbought, EXC Stock Gains 0.54% on Friday
On October 30, 2026: price 46.16 USD, trend uptrend, RSI 73.5, support 40.82, resistance 46.16. technical analysis of exc stock. RSI Overbought — full details…

Trend & Price Action
Exelon is trading above both its 20-day simple moving average, at $43.22, and its 50-day average, at $42.85. The 20-day average has risen 2.80% over five days, a sign that the short-term trend is strengthening rather than merely reflecting a single strong session. The 20-day average crossed above the 50-day average one session before the latest session, forming a golden cross—a common technical signal that shorter-term momentum has turned stronger than the longer-term trend. The close matched the stated 20-day resistance of $46.16 and put the share price at the top of its 20-day range. It was also near the three-month high of $47.09. That makes the level important in both directions: a sustained move above it would extend the breakout, while a failure to hold gains could leave recent buyers facing a pullback from an elevated position. The trend is bullish, but Exelon is testing resistance after a sharp run.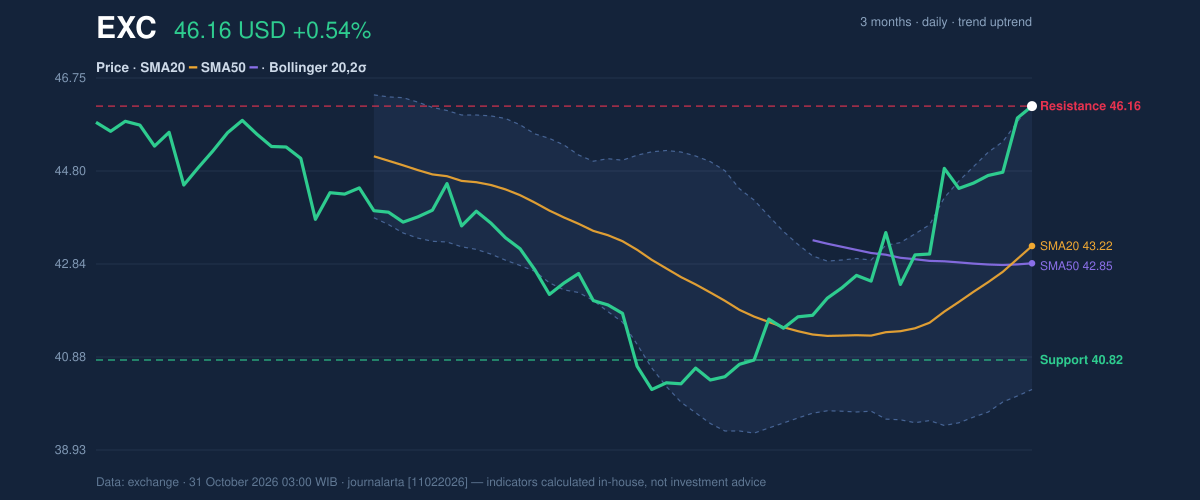
Oscillators & Momentum
The momentum indicators confirm the rally, but also warn that it may be crowded. The RSI is 73.5, in overbought territory; RSI compares the scale and speed of recent gains with recent losses, and readings above 70 are commonly treated as stretched. That does not by itself signal an imminent reversal, but it raises the risk that further gains could require a pause or consolidation. The Stochastic readings are also overbought, with %K at 82.9 and %D at 91.6. Meanwhile, the MACD is positive at 0.881, above its 0.487 signal line, with a positive 0.393 histogram. In plain terms, the trend-following momentum measure still favors the upside; it has not yet confirmed a reversal. The contrast is the key: MACD supports the advance, while RSI and Stochastic show limited room before short-term enthusiasm looks more extended.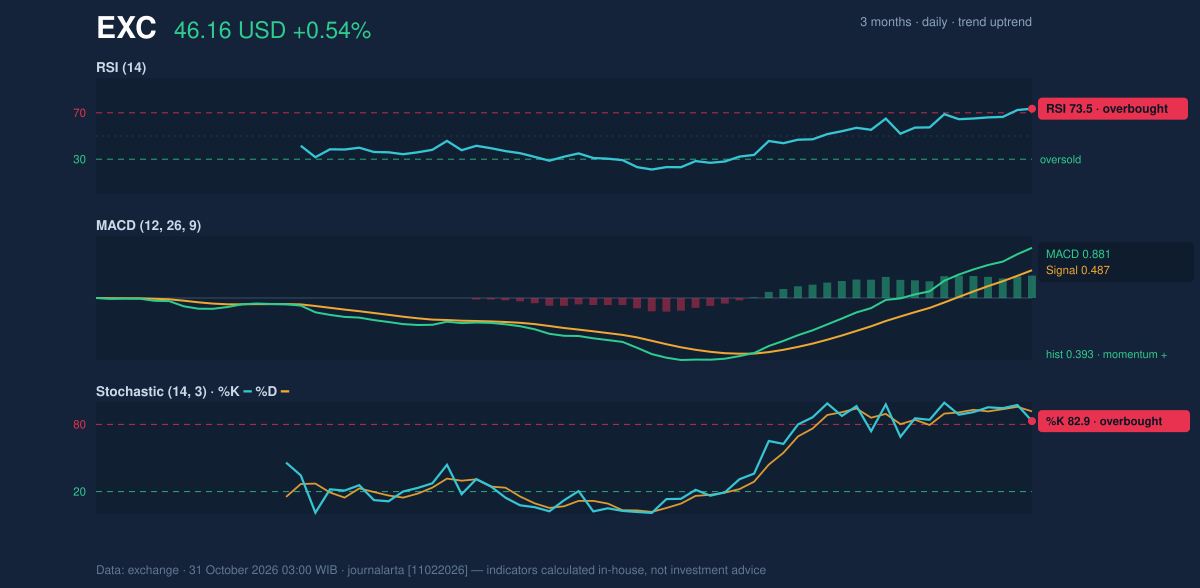
Volatility, Volume & Key Levels
Exelon’s price is near the upper Bollinger Band, at $46.24, with %B at 99%. Bollinger Bands track a moving average and a range around it; a reading near the upper band shows the price is pressing the top of that recent range, not that a breakout is guaranteed. The 14.0% band width is classified as normal, so the data do not indicate an unusually tight squeeze or a sharp volatility expansion. Average true range is $0.91, equivalent to 2.0% of the share price, pointing to moderate day-to-day movement. Volume was 2.5 times its 20-day average and on-balance volume rose. OBV tracks whether trading volume is flowing more heavily on rising or falling sessions; its increase offers additional confirmation that participation has accompanied the advance. Still, a surge in volume near resistance can mark either strong demand or an area where holders decide to take gains. The $47.09 three-month high is the next prominent reference above the close. A move beyond it would put the stock above the cited recent peak; failure to clear nearby resistance could instead leave the $46.16 level as a test of support. Below, the 20-day support is $40.82, while $39.73 marks the three-month low. Those levels are substantially below the latest close, underscoring the gap between the current breakout attempt and the range’s deeper support.Technical Verdict: BUY
The technical bias is bullish, supported by the golden cross formed one session earlier, an above-average volume surge alongside rising OBV, and positive MACD momentum. The main risk is near-term overextension: RSI at 73.5 and Stochastic readings in overbought territory leave the rally vulnerable to a pause. The verdict is invalidated if the price falls below the $40.82 20-day support.- Ideal entry range: $43.22–$46.16, bounded by the 20-day average and the 20-day resistance.
- Exit target: $47.09, the three-month high and next resistance reference.
- Stop-loss protection: $40.82, below the 20-day support.
Technical analysis describes chart conditions, not a recommendation to trade.
Why EXC is in focus today
- Volume at 2.5× the 20-day average
- Closed at a 20-day high (46.16)
- Trading near its 3-month high (47.09)
- Fresh golden cross: SMA20 crossed above SMA50
- RSI(14) at 73.5 — overbought zone
- Uptrend confirmed (5-day change 3.89%)
- Not covered by JournalArta in the last 14 days
Selected automatically from 100 NASDAQ (US) stocks by a technical-signal score with daily weighted randomisation — not a recommendation.
Summary Data EXC
| Last price | 46.16 USD |
| Change 1 day / 5 days / 1 month | 0.54% / 3.89% / 13.33% |
| Trend / MA-cross | uptrend / golden |
| SMA20 / SMA50 | 43.22 / 42.85 |
| RSI (14) / Stochastic %K | 73.5 / 82.9 |
| Bollinger %B / ATR | 99% / 0.91 |
| Support / Resistance 20 days | 40.82 / 46.16 |
| Data as of | 31 October 2026 03:00 WIB |
Disclaimer: This technical analysis is generated automatically from exchange data and indicators calculated by JournalArta, for information and education only. The verdict and the entry, target and stop-loss levels are not investment advice or a solicitation to buy or sell any security. Investment decisions and their risks rest solely with the reader.
Track EXC stock price daily: live levels, support/resistance and our full EXC analysis history.