ROP Stock Gains 3.77%, RSI Overbought In Focus
On October 30, 2026: price 466.60 USD, trend uptrend, RSI 82.3, support 358.57, resistance 466.60. technical analysis of rop stock. ROP Stock Gains — full…

Why ROP is in focus today
- One-day move of 3.77%, about 1.3× its average daily range (ATR)
- Volume at 2.1× the 20-day average
- Trading near its 3-month high (470.01)
- Fresh golden cross: SMA20 crossed above SMA50
- RSI(14) at 82.3 — overbought zone
- Uptrend confirmed (5-day change 6.50%)
- Not covered by JournalArta in the last 14 days
Selected automatically from 100 NASDAQ (US) stocks by a technical-signal score with daily weighted randomisation — not a recommendation.
Trend & Price Action
ROP’s price is well above its 20-day moving average of $398.64 and its 50-day average of $392.34. The 20-day average rose 6.17% over five days, indicating that the short-term trend itself is climbing quickly. A golden cross formed one session before the latest session, when the 20-day average moved above the 50-day average. That crossover supports the upward trend, though it describes a recent shift in average prices, not a guarantee that the share price will keep rising. The shares closed at the 20-day resistance level of $466.60 and were near the three-month high of $470.01. The price is therefore testing a ceiling where some traders may take profits or new buyers may hesitate. A sustained move above the three-month high would put the current rally on firmer ground; failure to clear that level could leave the shares vulnerable to a pullback. As shown in the chart, the upper Bollinger Band sits at $469.29, just above the close. Bollinger Bands map price movement around a moving average; a widening band signals higher volatility. Here, the band width is 35.4%, and the price is at 98% of the range between the lower and upper bands. That places ROP near the upper edge of its recent price envelope, consistent with strong demand but also with limited room before a possible pause.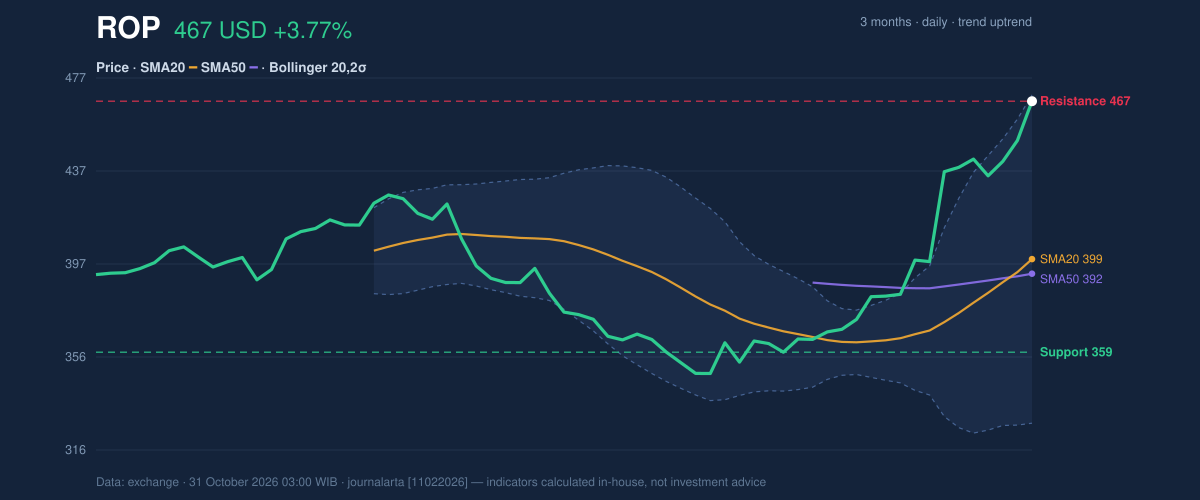
Oscillators & Momentum
The momentum indicators reinforce the bullish trend, but they also show why the rally merits caution. RSI is 82.3, in overbought territory; RSI gauges the speed and scale of recent price moves, and readings above 70 are commonly treated as stretched. Stochastic %K at 96.7 and %D at 94.7 are also overbought, indicating that the price has been closing near the top of its recent range. These readings do not by themselves predict a reversal, but they raise the risk that buyers may need a pause before extending the advance. MACD remains positive: its value is 20.562 against a signal line of 12.188, leaving a positive histogram of 8.374. The indicator compares shorter- and longer-term price momentum; the positive gap points to upward momentum still being in control. The MACD’s positive reading supports the trend, even as the oscillators warn that the move is crowded.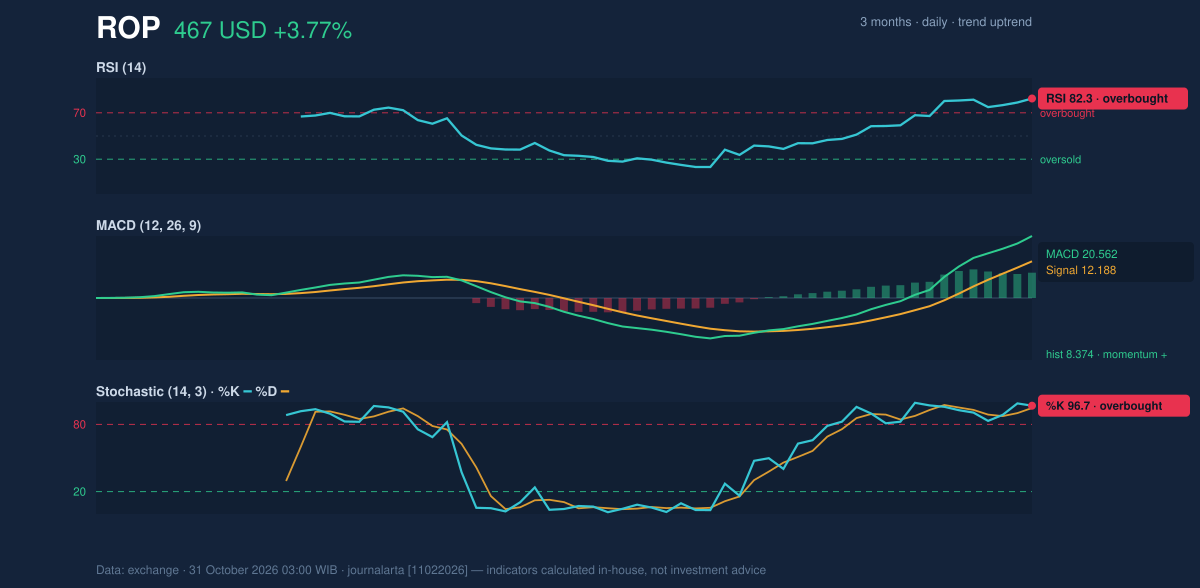
Volatility, Volume & Key Levels
The latest daily gain was about 1.3 times the Average True Range (ATR), which measures typical price movement; ATR stands at $13.61, or 2.9% of the share price. That points to a forceful session within a market environment the data characterizes as moderately volatile. The volume surge and rising OBV add confirmation, while the price’s proximity to resistance makes follow-through important. The relevant levels are $470.01, the three-month high, and $358.57, the 20-day support. A breakout above the high would establish a move beyond the current three-month ceiling. If the shares instead retreat, the data’s volatility-based reference at $446.19—the price minus 1.5 times ATR—offers a nearer marker to monitor; a deeper decline would bring the 20-day support into focus.Technical Verdict: BUY
The supplied technical bias is bullish, with three of seven signals positive and none negative. The strongest supports are the golden cross formed one session earlier, the close above the 20-day high on volume at least 1.5 times average, and rising OBV. The main counterweight is stretched momentum: RSI at 82.3 and Stochastic readings above 94 point to overbought conditions. The bullish verdict is invalidated if the price falls below the 20-day support of $358.57. The levels below are technical reference points drawn from the supplied data, not investment advice: - Ideal entry range: $446.19–$466.60, using the 1.5×ATR reference and the 20-day resistance. - Exit target: $470.01, the next stated resistance at the three-month high. - Stop-loss protection: $358.57, below the 20-day support. In plain English, the chart favors the upward trend, but the shares are stretched and approaching a level that may be difficult to clear.Summary Data ROP
| Last price | 466.60 USD |
| Change 1 day / 5 days / 1 month | 3.77% / 6.50% / 31.69% |
| Trend / MA-cross | uptrend / golden |
| SMA20 / SMA50 | 398.64 / 392.34 |
| RSI (14) / Stochastic %K | 82.3 / 96.7 |
| Bollinger %B / ATR | 98% / 13.61 |
| Support / Resistance 20 days | 358.57 / 466.60 |
| Data as of | 31 October 2026 03:00 WIB |
Disclaimer: This technical analysis is generated automatically from exchange data and indicators calculated by JournalArta, for information and education only. The verdict and the entry, target and stop-loss levels are not investment advice or a solicitation to buy or sell any security. Investment decisions and their risks rest solely with the reader.
Track ROP stock price daily: live levels, support/resistance and our full ROP analysis history.