RSI Oversold, INTC Stock Drops 28.58% on Friday
On October 30, 2026: price 65.76 USD, trend downtrend, RSI 25.2, support 65.76, resistance 116.19. technical analysis of intc stock. RSI Oversold — full…
Why INTC is in focus today
- One-day move of -28.58%, about 2.7× its average daily range (ATR)
- Volume at 3.9× the 20-day average
- Closed at a 20-day low (65.76)
- Fresh death cross: SMA20 crossed below SMA50
- RSI(14) at 25.2 — oversold zone
- Downtrend extending (5-day change -24.38%)
Selected automatically from 100 NASDAQ (US) stocks by a technical-signal score with daily weighted randomisation — not a recommendation.
Trend & Price Action
Intel closed well below its 20-day moving average of $96.39 and its 50-day average of $101.11. The 20-day average itself fell 7.40% over five days, indicating that weakness is embedded in the shorter-term trend rather than limited to one session. A death cross formed two sessions before the latest session—the point at which the 20-day average crossed below the 50-day average. This is a backward-looking signal, but it reinforces the deterioration in price structure. The one-day fall was about 2.7 times the average daily trading range implied by the $6.86 average true range, or ATR. ATR estimates typical price movement; at 10.4% of Intel’s share price, it signals unusually high volatility. The stock’s monthly decline reached 44.89%, while its five-day fall was 24.38%. The close at $65.76 sits at the 20-day support level and at the bottom of the stated 20-day range. It is also near the three-month low of $63.20. That proximity makes the area a crucial test: a move below it would extend the breakdown, while holding it would show only that selling paused at a level where buyers may attempt to defend the price.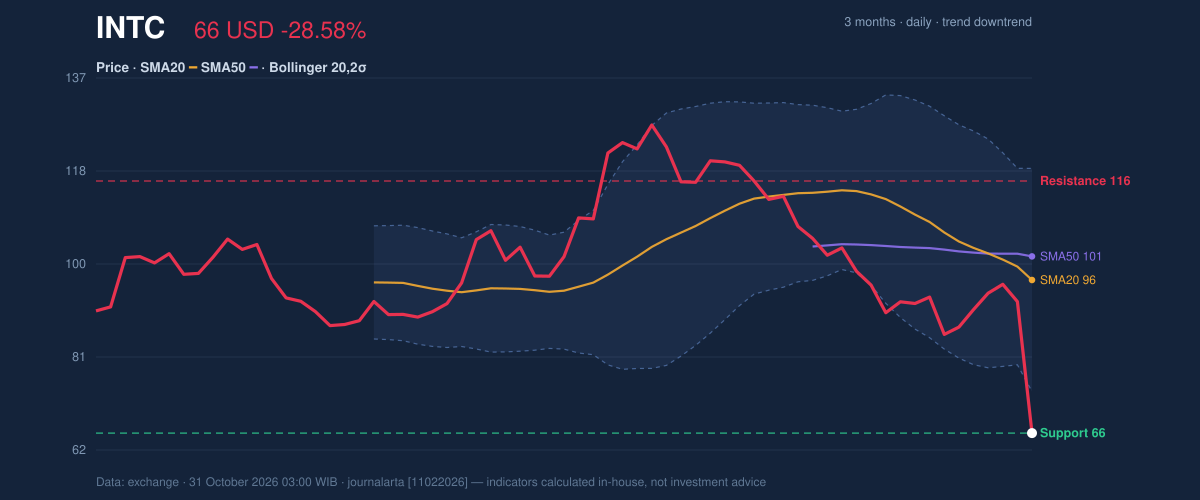
Oscillators & Momentum
The relative strength index, or RSI, was 25.2, while the stochastic readings were 6.5 for %K and 30.8 for %D. Both indicators are in oversold territory, meaning recent losses have been unusually intense compared with their measurement periods. That can precede a rebound, but it does not confirm one: in a steep downtrend, oversold conditions can persist. RSI and Stochastic are oversold, while MACD remains negative. The moving average convergence divergence indicator (MACD) stood at -6.347 against a signal line of -4.365, with a negative histogram of -1.982. In plain terms, the price momentum measure remains weaker than its signal line, so the oversold readings are not yet matched by evidence of a momentum reversal.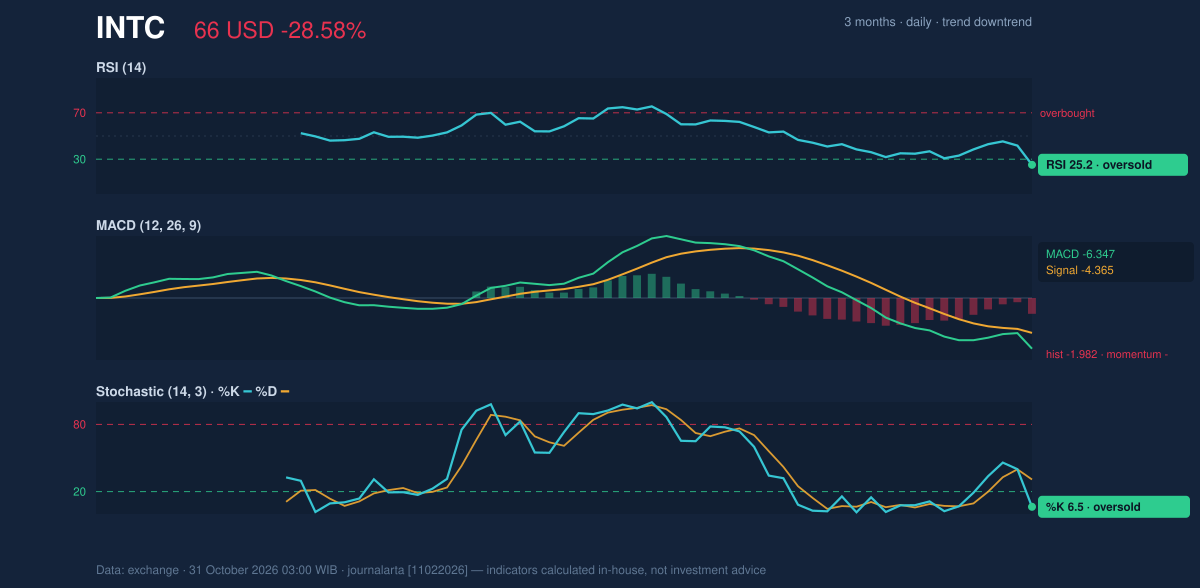
Volatility & Volume
Intel traded 454,221,300 shares, against a 20-day average of 116,311,520. Such a large volume surge alongside a record-low close for the 20-day range suggests broad participation in the decline, rather than a move on thin trading. On-balance volume (OBV), which tracks whether trading volume is flowing more heavily on rising or falling sessions, also declined, confirming that selling pressure has been accumulating. The Bollinger bands, which frame a moving average using recent price volatility, have widened to 46.3%. Their lower boundary is $74.08, already above the latest close, and %B is -19%. That reading places the price below the lower band, a sign of an unusually stretched move. Widening bands and a close beneath the lower band point to high volatility, not a guaranteed bounce.Key Levels & Scenarios
The immediate reference is $65.76 support, with the three-month low at $63.20. A sustained break below those levels would put the data-derived $55.47 level—price less 1.5 times ATR—in view as a downside reference, not a forecast. On any recovery, $74.08, the lower Bollinger band, is an initial marker; the 20-day average at $96.39 and $116.19 resistance sit further above. A move through resistance would still need confirmation from momentum and volume.Technical Verdict: SELL
The technical bias is bearish, with three of seven tracked signals bearish and none bullish. The case rests on the death cross formed two sessions earlier, the close below the 20-day low on volume well above average, and declining OBV. Oversold RSI and Stochastic readings are a risk to a straight-line decline, but negative MACD offers no confirmation that momentum has turned. - Entry range: $65.76–$74.08, bounded by 20-day support and the lower Bollinger band. - Exit target: $65.76, the 20-day support reference; if that level gives way, $63.20, the three-month low. - Stop-loss protection: $116.19, above the 20-day resistance reference. - Invalidation: The bearish verdict is invalidated if price breaks above $116.19. For non-traders, the indicators show that selling pressure remains dominant, although an unusually sharp fall can still produce a temporary rebound.| Indicator | Reading |
|---|---|
| Latest close | $65.76 |
| Daily / five-day / monthly change | -28.58% / -24.38% / -44.89% |
| SMA20 / SMA50 | $96.39 / $101.11 |
| RSI(14) / Stochastic %K, %D | 25.2 / 6.5, 30.8 |
| MACD / signal / histogram | -6.347 / -4.365 / -1.982 |
| Volume / 20-day average | 454,221,300 / 116,311,520 |
| 20-day support / resistance | $65.76 / $116.19 |
Summary Data INTC
| Last price | 65.76 USD |
| Change 1 day / 5 days / 1 month | -28.58% / -24.38% / -44.89% |
| Trend / MA-cross | downtrend / death |
| SMA20 / SMA50 | 96.39 / 101.11 |
| RSI (14) / Stochastic %K | 25.2 / 6.5 |
| Bollinger %B / ATR | -19% / 6.86 |
| Support / Resistance 20 days | 65.76 / 116.19 |
| Data as of | 31 October 2026 03:00 WIB |
Disclaimer: This technical analysis is generated automatically from exchange data and indicators calculated by JournalArta, for information and education only. The verdict and the entry, target and stop-loss levels are not investment advice or a solicitation to buy or sell any security. Investment decisions and their risks rest solely with the reader.
Track INTC stock price daily: live levels, support/resistance and our full INTC analysis history.