ABNB Stock Gains 4.09%, Momentum Weakens In Focus
On November 2, 2026: price 171.11 USD, trend sideways, RSI 54.4, support 160.39, resistance 176.94. technical analysis of abnb stock. ABNB Stock Gains — full…

Why ABNB is in focus today
- One-day move of 4.09%, about 1.6× its average daily range (ATR)
- Volume at 1.8× the 20-day average
Selected automatically from 100 NASDAQ (US) stocks by a technical-signal score with daily weighted randomisation — not a recommendation.
Trend & Price Action
The latest close was above the 20-day simple moving average (SMA) of $168.80, but only slightly above the 50-day average of $170.06. A simple moving average smooths recent prices to help show the underlying trend. The 20-day average rose 0.96% over five days, yet the broader trend remains sideways; there has been no new crossover between the averages. That combination suggests prices have steadied, not that a sustained uptrend is established. The technical bias remains neutral: the price is above its 20-day average and has pulled back toward that average while still above the 50-day line, but momentum signals do not confirm a clear advance. The stock sits at 65% of its 20-day range, between support at $160.39 and resistance at $176.94. Its three-month high and low are $193.45 and $148.65, respectively, leaving the latest price below the period’s peak. As shown in the chart, the price is above the Bollinger middle band, but still within the bands rather than pressing their upper edge.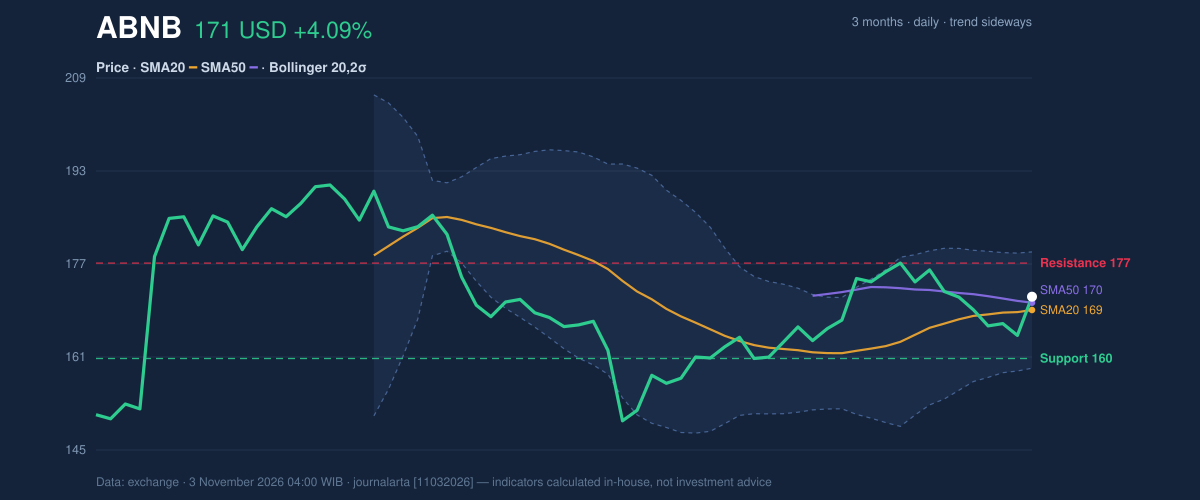
Oscillators & Momentum
The RSI, or Relative Strength Index, is 54.4—neutral territory that indicates neither unusually strong buying nor an oversold market. The Stochastic reading is also neutral: %K is 47.6 and %D is 27.1. This indicator compares a closing price with its recent trading range; the gap between its two lines points to differing short-term readings, not a confirmed trend by itself. MACD offers the clearest caution. Its value is 0.552, below the signal line at 0.901, and its histogram is negative at -0.350. The histogram measures the distance between those lines; a negative reading means short-term momentum is weaker than the signal line suggests. It is one bearish signal, even as the close advanced sharply. The chart brings those readings together: neutral RSI and Stochastic readings sit alongside a negative MACD histogram, a mixed picture rather than broad momentum confirmation.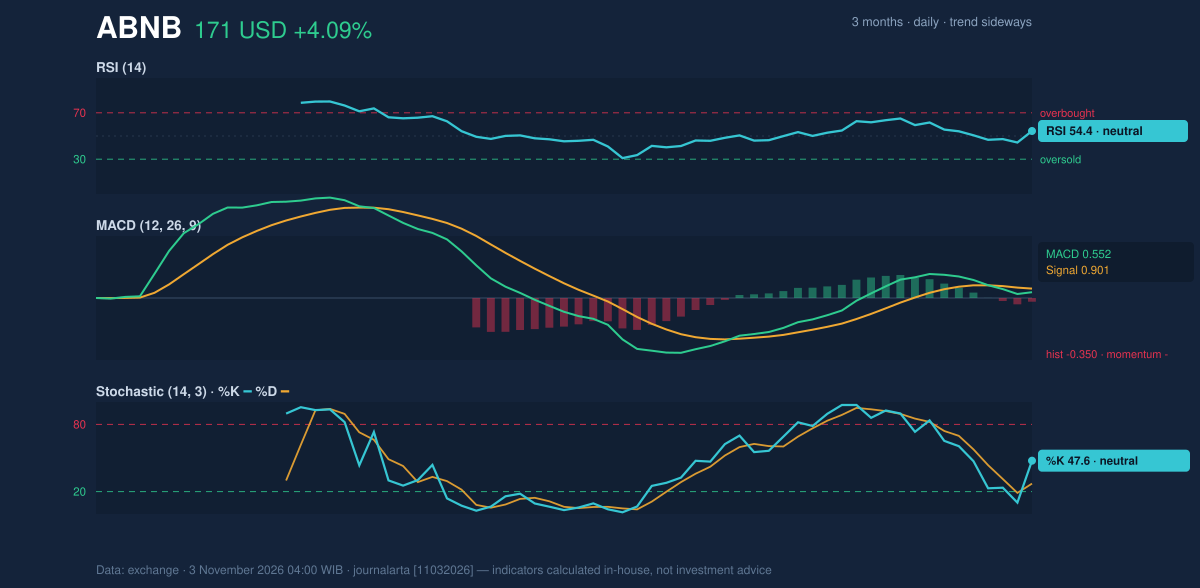
Volatility, Volume & Levels
The Bollinger Bands—bands around a moving average that reflect recent price variation—are at $158.71 below and $178.89 above, with the middle at $168.80. The close’s position corresponds to 61% of the band width, while the 12.0% width is classified as normal, not a squeeze or a pronounced expansion. The 14-day Average True Range (ATR), a measure of typical price movement, is $4.47, or 2.6% of the share price: volatility is moderate. Volume of 5,957,000 was 1.8 times the 20-day average of 3,327,665. That increase confirms unusually heavy participation in the session, but falling OBV complicates the reading: volume has not been accumulating in a way that clearly supports the price rise. A close above $176.94 would clear 20-day resistance; the next cited reference is the three-month high at $193.45. If the price retreats, the 20-day support at $160.39 is the key nearby level, with the three-month low at $148.65 below it. The price-minus-1.5-ATR reference is $164.40, another data-based marker for assessing a pullback.Technical Verdict: HOLD
HOLD (wait & see) matches the neutral technical bias. The strongest reasons are the sideways trend despite the 20-day average’s 0.96% five-day rise, the negative MACD histogram at -0.350, and declining OBV despite above-average volume. The verdict is invalidated if the price breaks below the 20-day support at $160.39. - Ideal entry range: $168.80–$170.06, bounded by the 20-day and 50-day averages. - Exit target: $176.94, the 20-day resistance. - Stop-loss protection: $160.39, the 20-day support level. For non-traders, the signals are mixed enough that the price has not established a clear direction.| Metric | Reading |
|---|---|
| Latest price | $171.11 |
| One-day change | +4.09% |
| Five-day change | +0.04% |
| One-month change | +4.29% |
| Technical bias | Neutral |
| Session | Monday, November 2, 2026 |
Summary Data ABNB
| Last price | 171.11 USD |
| Change 1 day / 5 days / 1 month | 4.09% / 0.04% / 4.29% |
| Trend / MA-cross | sideways / none |
| SMA20 / SMA50 | 168.80 / 170.06 |
| RSI (14) / Stochastic %K | 54.4 / 47.6 |
| Bollinger %B / ATR | 61% / 4.47 |
| Support / Resistance 20 days | 160.39 / 176.94 |
| Data as of | 3 November 2026 04:00 WIB |
Disclaimer: This technical analysis is generated automatically from exchange data and indicators calculated by JournalArta, for information and education only. The verdict and the entry, target and stop-loss levels are not investment advice or a solicitation to buy or sell any security. Investment decisions and their risks rest solely with the reader.
Track ABNB stock price daily: live levels, support/resistance and our full ABNB analysis history.