BKR Stock Drops 3.95% on Monday, Testing Support Level
On November 2, 2026: price 53.05 USD, trend downtrend, RSI 40.4, support 53.05, resistance 59.00. technical analysis of bkr stock. BKR Stock Drops — full…
Why BKR is in focus today
- Trading near its 3-month low (52.59)
- MACD histogram has just turned negative
- Downtrend extending (5-day change -5.28%)
- Not covered by JournalArta in the last 14 days
Selected automatically from 100 NASDAQ (US) stocks by a technical-signal score with daily weighted randomisation — not a recommendation.
Trend & Price Action
BKR lost 5.28% over five trading days and 7.55% over one month. The shares closed below the 20-day moving average of $55.65 and the 50-day average of $57.94, while the 20-day average itself fell 0.30% over five days. That configuration places the price within a broader downtrend, with no new moving-average crossover to suggest the trend has changed. The price also finished below the lower Bollinger Band, at $53.15. Bollinger Bands track a stock’s usual range of movement; a close beneath the lower band can signal unusually strong selling pressure, though it does not by itself establish that a rebound is imminent. Here, the move is consistent with the weak trend rather than an isolated technical dip. BKR is at the bottom of its 20-day range, with the three-month low of $52.59 close by.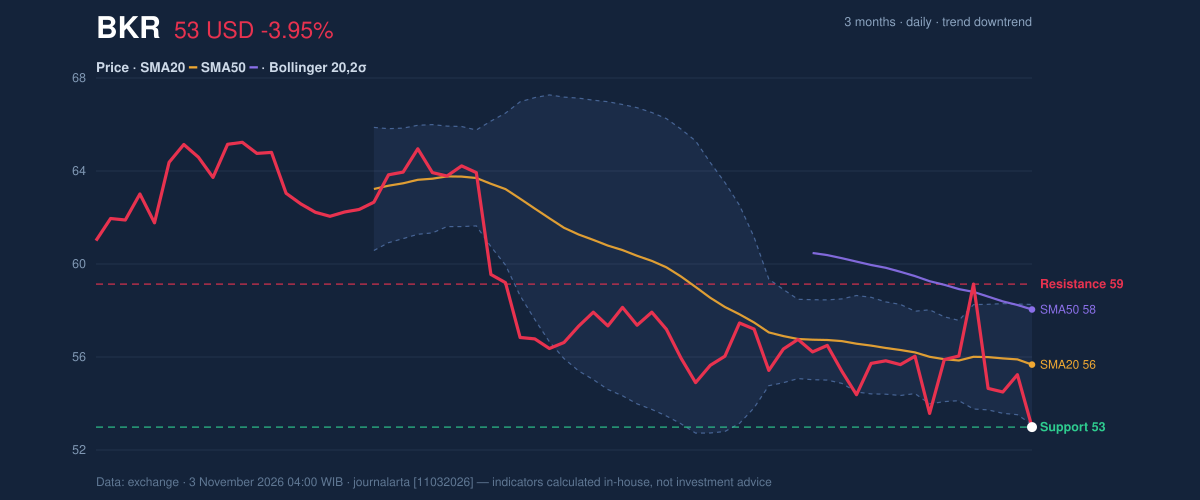
Oscillators & Momentum
Momentum signals are mixed, but the balance leans lower. The 14-day RSI is 40.4, a neutral reading that has not reached oversold territory. The Stochastic oscillator, which compares a closing price with its recent trading range, is deeper into oversold territory: %K is 7.1 and %D is 25.7. That can reflect persistent selling, not necessarily an imminent reversal. The MACD is also negative: its reading is -0.814, below the -0.780 signal line, with a histogram of -0.034. The histogram’s turn into negative territory marks a loss of short-term momentum. It is one reason the technical bias is bearish, even as the Stochastic reading suggests the decline may be stretched. Oversold Stochastic readings show pressure has been intense; the negative MACD says that pressure has not yet clearly eased.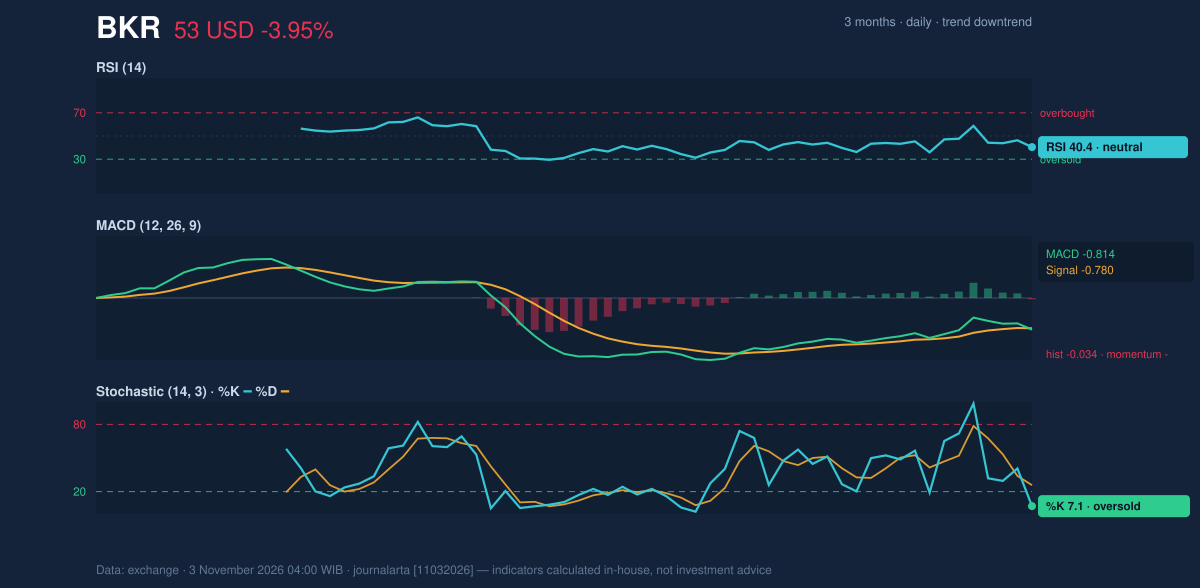
Volatility & Volume
The day’s volume of 9,322,000 shares was 1.3 times the 20-day average of 7,371,975. Higher-than-normal activity gives the decline more weight: it indicates broader participation in the move than a fall on thin trading would. On-balance volume, which tracks whether volume is flowing more with rising or falling prices, also declined, reinforcing the bearish reading. The 14-day average true range is $2.07, or 3.9% of the share price, indicating high volatility. In plain terms, daily moves can be large relative to the stock’s price, so nearby support levels may be tested quickly. The Bollinger Band width is 9.0%, classified as normal rather than unusually tight; the close below the lower band is the more immediate warning.Key Levels & Scenarios
At $53.05, the shares sit at the stated 20-day support of $53.05. The next important reference is the three-month low at $52.59. A break below that low would extend the decline beyond the recent range. If support holds, the $55.65 20-day average is an initial level to watch for a recovery; the 20-day resistance stands at $59.00. A move back above the 20-day average would ease the immediate pressure, but would not alone erase the downtrend while BKR remains below its 50-day average.Technical Verdict: SELL
The bearish verdict matches the supplied technical bias. The strongest signals are the negative MACD histogram (-0.034), the close below the lower Bollinger Band at $53.15, and falling OBV alongside above-average trading volume. The oversold Stochastic reading is a counter-signal, but it has not yet been confirmed by a positive MACD shift or a recovery above the short-term average. - Ideal entry range: $53.05–$55.65, spanning 20-day support and the 20-day average. - Exit target: $52.59, the three-month low and next reference below 20-day support. - Stop-loss protection: $59.00, the 20-day resistance; the alternative volatility reference is $56.16, price plus 1.5 times ATR. - Invalidation: The bearish verdict is invalidated if price breaks above $59.00. For non-traders, the signals currently point to more downside risk than evidence of a lasting recovery, though a sharp move remains possible. Data are for the Monday, November 2, 2026 exchange session. Technical analysis describes indicator-based conditions, not a personalized investment recommendation.Summary Data BKR
| Last price | 53.05 USD |
| Change 1 day / 5 days / 1 month | -3.95% / -5.28% / -7.55% |
| Trend / MA-cross | downtrend / none |
| SMA20 / SMA50 | 55.65 / 57.94 |
| RSI (14) / Stochastic %K | 40.4 / 7.1 |
| Bollinger %B / ATR | -2% / 2.07 |
| Support / Resistance 20 days | 53.05 / 59.00 |
| Data as of | 3 November 2026 04:00 WIB |
Disclaimer: This technical analysis is generated automatically from exchange data and indicators calculated by JournalArta, for information and education only. The verdict and the entry, target and stop-loss levels are not investment advice or a solicitation to buy or sell any security. Investment decisions and their risks rest solely with the reader.
Track BKR stock price daily: live levels, support/resistance and our full BKR analysis history.