ETN Stock Analysis: Drops 1.05%, Testing Support Level
On November 2, 2026: price 366.07 USD, trend downtrend, RSI 35.8, support 366.07, resistance 445.09. technical analysis of etn stock. ETN Stock Analysis — full…

Why ETN is in focus today
- Closed at a 20-day low (366.07)
- Downtrend extending (5-day change -1.57%)
- Not covered by JournalArta in the last 14 days
Selected automatically from 80 NYSE (US) stocks by a technical-signal score with daily weighted randomisation — not a recommendation.
Trend & Price Action
Eaton finished below both its 20-day moving average of $398.47 and its 50-day average of $410.07. The 20-day average itself fell 3.18% over five days, a sign that weakness is embedded in the short-term trend rather than confined to a single session. No new moving-average crossover formed. The one-day decline was 1.05%, while the one-month loss reached 15.38%. Those figures show how the latest low sits within a broader retreat, not simply a short-lived daily dip. The price is at the lower edge of its 20-session range, and just above the three-month low of $358.51. The trend is down, but the stock is also testing a level where selling pressure may meet support. The Bollinger lower band is $349.79, compared with the middle band at $398.47 and the upper band at $447.15. Bollinger bands track how far price moves from its recent average; the 24.4% band width signals elevated volatility. At 17% of the band range, the share price is near the lower band, consistent with persistent weakness but not, by itself, proof of a reversal.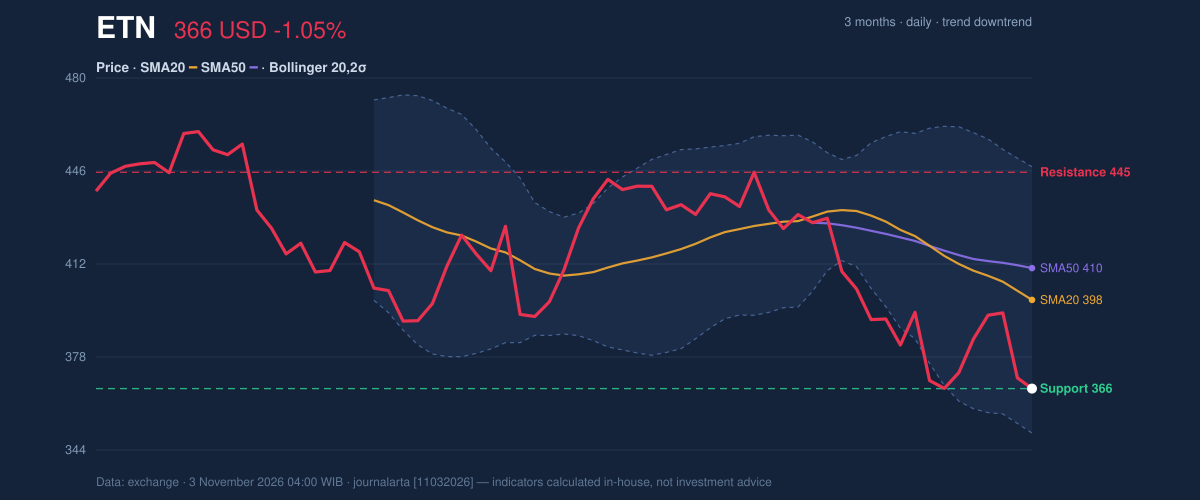
Oscillators & Momentum
Momentum indicators lean negative, though they offer a limited counterpoint. The RSI is 35.8, classified as neutral, while the technical signal set identifies it as rebounding from below 35. RSI compares the scale of recent gains and losses; a rebound from a low reading can indicate that selling momentum is easing, but it does not establish that the trend has turned. The Stochastic is oversold, with %K at 11.4 and %D at 24.6. This measure compares a closing price with its recent range, so a low reading says the price has been near the bottom of that range. It can flag stretched selling, but in a downtrend such conditions can persist. The MACD remains a clearer warning: MACD at -13.002 is below its -11.011 signal line, with a negative -1.992 histogram. That configuration points to downside momentum. The overall technical bias is neutral, with one bullish signal and one bearish signal; falling on-balance volume (OBV), which tracks whether trading volume accompanies rising or falling prices, confirms the bearish side.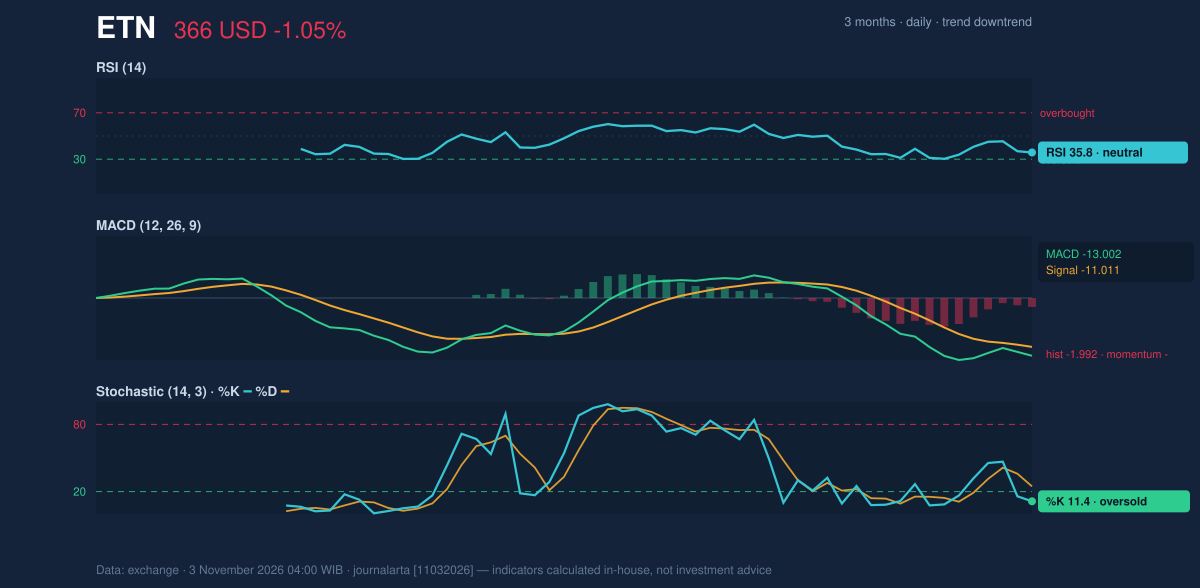
Volatility, Volume & Key Levels
Trading volume was 3,187,900 shares, or 1.2 times the 20-session average of 2,621,380, while OBV declined. The combination matters: the fall drew above-normal participation, and the volume trend does not yet show accumulation that would strengthen a recovery case. Average true range (ATR), a measure of typical price movement, was $17.42, equal to 4.8% of the share price. That points to sizeable day-to-day swings. The immediate reference is $366.07 support, the 20-session low. Below it, the three-month low at $358.51 is the next cited floor. On the upside, the 20-session resistance is $445.09; beyond that sits the three-month high of $478.00. A move toward the 20-day average at $398.47 would be an initial test of whether the stock can reclaim lost ground, not confirmation on its own. If support holds, oversold momentum could give way to stabilization. A break below $358.51, however, would undermine that case; a move above $445.09 would be needed to clear the stated 20-session resistance.Technical Verdict: HOLD (wait & see)
The neutral verdict follows the data’s mixed signals: the downtrend is confirmed by price below both moving averages and falling OBV, while the oversold stochastic and RSI rebound provide a counterweight. Negative MACD momentum adds caution, but the specified technical bias remains neutral. - Ideal entry range: $358.51–$366.07, framed by the three-month low and 20-session support. - Exit target: $445.09, the 20-session resistance. - Stop-loss protection: $349.79, the lower Bollinger band; a break below $358.51 would also invalidate the support-based case. For non-traders, HOLD means the indicators do not yet point clearly toward either a durable recovery or a decisive breakdown.Summary Data ETN
| Last price | 366.07 USD |
| Change 1 day / 5 days / 1 month | -1.05% / -1.57% / -15.38% |
| Trend / MA-cross | downtrend / none |
| SMA20 / SMA50 | 398.47 / 410.07 |
| RSI (14) / Stochastic %K | 35.8 / 11.4 |
| Bollinger %B / ATR | 17% / 17.42 |
| Support / Resistance 20 days | 366.07 / 445.09 |
| Data as of | 3 November 2026 04:00 WIB |
Disclaimer: This technical analysis is generated automatically from exchange data and indicators calculated by JournalArta, for information and education only. The verdict and the entry, target and stop-loss levels are not investment advice or a solicitation to buy or sell any security. Investment decisions and their risks rest solely with the reader.
Track ETN stock price daily: live levels, support/resistance and our full ETN analysis history.