GE Stock Gains 4.63% on Monday, Testing Key Resistance
On November 2, 2026: price 315.78 USD, trend sideways, RSI 55.1, support 285.64, resistance 315.78. technical analysis of ge stock. GE Stock Gains — full…

Why GE is in focus today
- One-day move of 4.63%, about 1.3× its average daily range (ATR)
- Closed at a 20-day high (315.78)
Selected automatically from 80 NYSE (US) stocks by a technical-signal score with daily weighted randomisation — not a recommendation.
Trend & Price Action
The one-day gain extended GE’s five-day rise to 9.48%, although the shares are up just 3.08% over one month. That contrast suggests a sharp recent rebound within a broader sideways pattern, rather than a confirmed longer-term breakout. The price is above its $304.00 20-day moving average, but remains just below the $316.66 50-day average. The 20-day average’s slope is negative, having fallen 0.48% over five days—a sign that the shorter-term trend has not yet turned decisively higher. There is no new moving-average crossover. In plain terms, the short-term average has not crossed the longer-term one to confirm a trend shift. The distinction matters because the latest close is testing resistance, not moving through a level that would by itself establish a sustained uptrend. As shown in the chart, GE finished at the $315.78 20-day resistance, at the top of its recorded 20-session range. The three-month high of $388.84 is substantially higher, while the three-month low is $278.37.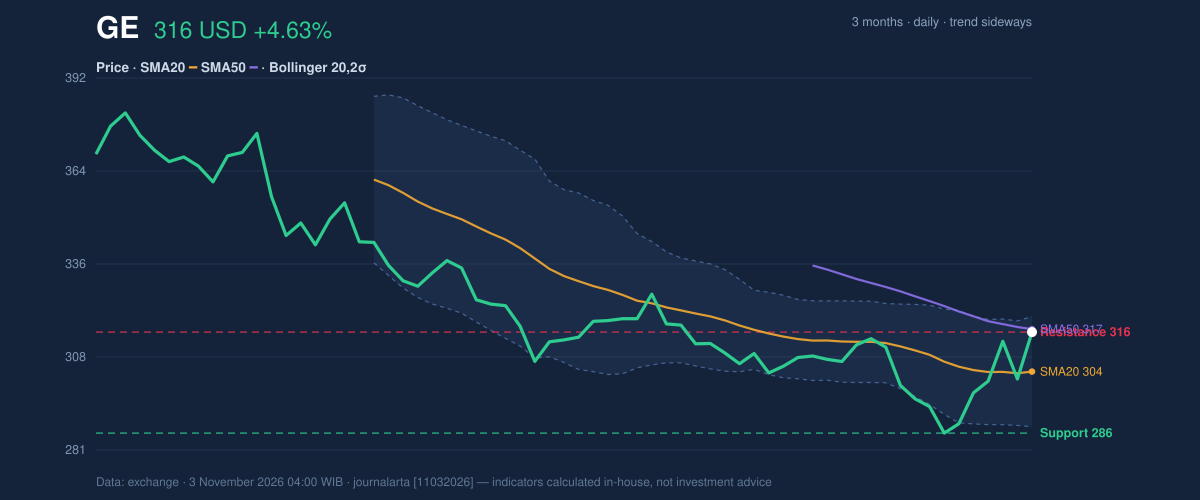
Oscillators & Momentum
Momentum indicators offer a mixed reading. The RSI is 55.1, in neutral territory: it indicates neither unusually strong buying nor an oversold rebound. The Stochastic %K at 87.4 and %D at 74.4 signals overbought conditions. This oscillator compares recent closes with a recent price range; a high reading can indicate that a rally has advanced quickly, though it does not, on its own, establish that a reversal is underway. The MACD histogram is positive at 2.295, with MACD at -3.719 above its -6.013 signal line. That relationship points to improving short-term momentum even though the MACD itself remains below zero, so the rebound has gained force without fully removing the weaker trend signal. As shown in the chart, the RSI, MACD and Stochastic readings capture the tension between improving momentum and a stretched short-term move.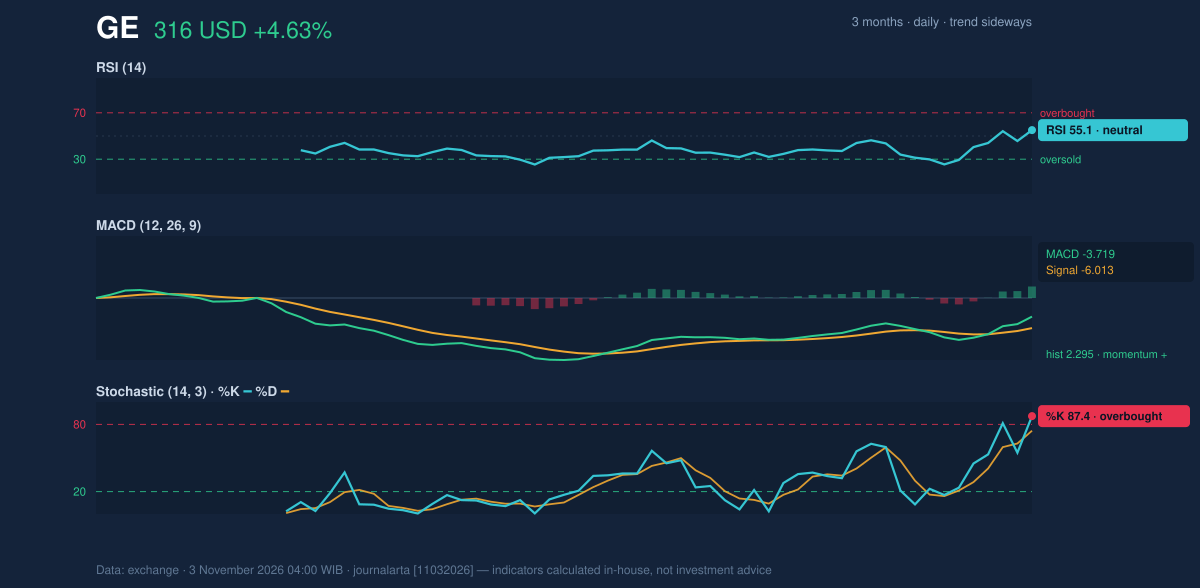
Volatility, Volume & Levels
GE’s Bollinger Bands—the range built around a moving average to show price dispersion—have a normal width of 10.8%, not a squeeze that would indicate unusually compressed trading. The %B reading of 86% places the stock near the upper band, at $320.45, with the middle band at $304.00 and lower band at $287.55. This proximity reinforces the possibility that the rally is testing its near-term limits, though the bands alone do not predict a pullback. Average True Range, a measure of typical price movement, is $10.87, or 3.4% of the share price, indicating moderate volatility. The latest move was larger than that average range. Yet trading volume of 4,819,800 shares was only 0.9 times its 20-session average of 5,233,975, while on-balance volume—an indicator that tracks whether volume tends to accompany rises or falls—was declining. The advance therefore lacked confirmation from broader trading participation. The immediate test is whether GE can hold above its $315.78 resistance; a sustained move beyond it would put the $388.84 three-month high in view as a reference level. A failure to hold near the 20-day moving average at $304.00 would weaken the rebound, with the $285.64 20-day support marking a deeper reference point.Technical Verdict: HOLD (wait & see)
The data-defined technical bias is neutral, so the verdict remains HOLD (wait & see). The strongest signals are the neutral RSI at 55.1, the overbought Stochastic readings, and the positive MACD histogram against a declining 20-day average and falling OBV. The price has reached resistance, but lower-than-average volume leaves the breakout unconfirmed. - Illustrative entry range: $304.00–$315.78, between the 20-day average and 20-day resistance. - Illustrative exit target: $320.45, the upper Bollinger Band. - Illustrative stop-loss protection: $299.48, the price minus 1.5 times ATR. - Invalidation condition: The neutral verdict is invalidated if the price falls below $285.64, the 20-day support. For non-traders, the indicators show a strong short-term bounce but not enough agreement to confirm that it has become a durable uptrend.Summary Data GE
| Last price | 315.78 USD |
| Change 1 day / 5 days / 1 month | 4.63% / 9.48% / 3.08% |
| Trend / MA-cross | sideways / none |
| SMA20 / SMA50 | 304.00 / 316.66 |
| RSI (14) / Stochastic %K | 55.1 / 87.4 |
| Bollinger %B / ATR | 86% / 10.87 |
| Support / Resistance 20 days | 285.64 / 315.78 |
| Data as of | 3 November 2026 04:00 WIB |
Disclaimer: This technical analysis is generated automatically from exchange data and indicators calculated by JournalArta, for information and education only. The verdict and the entry, target and stop-loss levels are not investment advice or a solicitation to buy or sell any security. Investment decisions and their risks rest solely with the reader.
Track GE stock price daily: live levels, support/resistance and our full GE analysis history.