Golden Cross Formed, PYPL Stock Gains 3.10% on Monday
On November 2, 2026: price 58.78 USD, trend uptrend, RSI 64.7, support 54.61, resistance 58.78. technical analysis of pypl stock. Golden Cross Formed — full…
Why PYPL is in focus today
- One-day move of 3.10%, about 1.3× its average daily range (ATR)
- Closed at a 20-day high (58.78)
- Fresh golden cross: SMA20 crossed above SMA50
- Breaking out of a Bollinger squeeze (band width 7.1%)
- Uptrend confirmed (5-day change 6.89%)
Selected automatically from 100 NASDAQ (US) stocks by a technical-signal score with daily weighted randomisation — not a recommendation.
Trend & Price Action
PayPal’s shares rose 6.89% over five days and 8.03% over one month. The price is above both its 20-day simple moving average, at $56.40, and its 50-day average, at $55.31. The 20-day average rose 1.68% over five days, showing that the shorter-term trend is strengthening rather than merely holding steady. The 20-day average crossed above the 50-day average three sessions before the latest session. This “golden cross” signals improving recent price momentum relative to the longer trend; it is a trend indicator, not a guarantee that gains will continue. The close at $58.78 also sits at the 20-day resistance level and at the top of the stated 20-day range. That makes the level a test: a close above it would put the three-month high of $62.73 in view, while a failure to hold gains could bring the moving averages back into focus. The chart shows the price above its moving averages and above the upper Bollinger Band.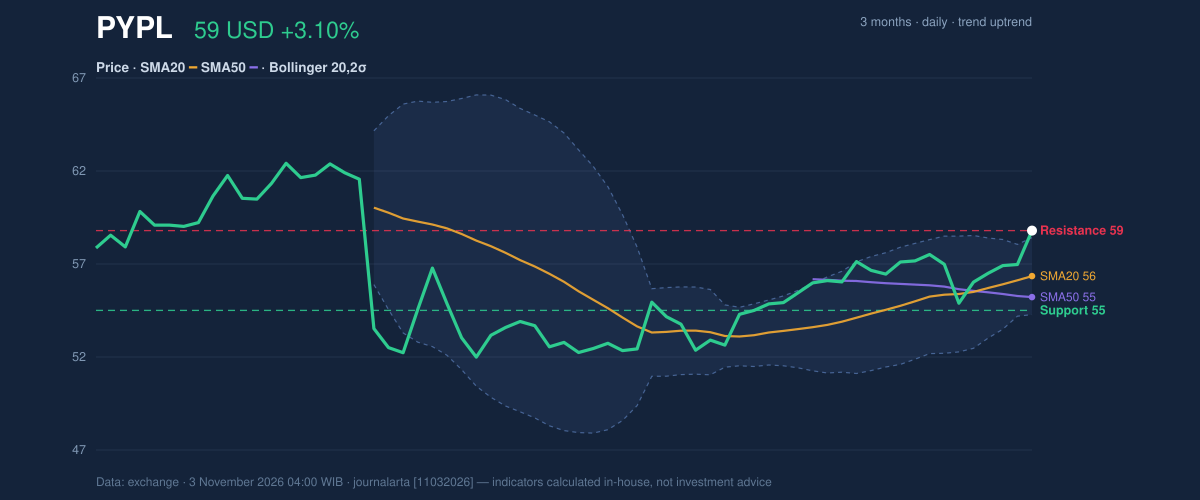
Oscillators & Momentum
Momentum readings broadly support the upward trend, but they differ on how far the move may have run. The RSI is 64.7, a neutral reading: it indicates firm momentum without entering the data’s overbought category. The Stochastic is overbought, with %K at 94.7 and %D at 80.3. That can reflect strong buying pressure, but it also warns that the price may be vulnerable to a pause or pullback after its recent climb. The MACD is positive at 0.641, above its 0.487 signal line, with a positive 0.154 histogram. MACD compares shorter- and longer-term price momentum; a positive reading above its signal line indicates that upward momentum is currently in the lead. It confirms the trend, though it does not remove the short-term caution from the Stochastic.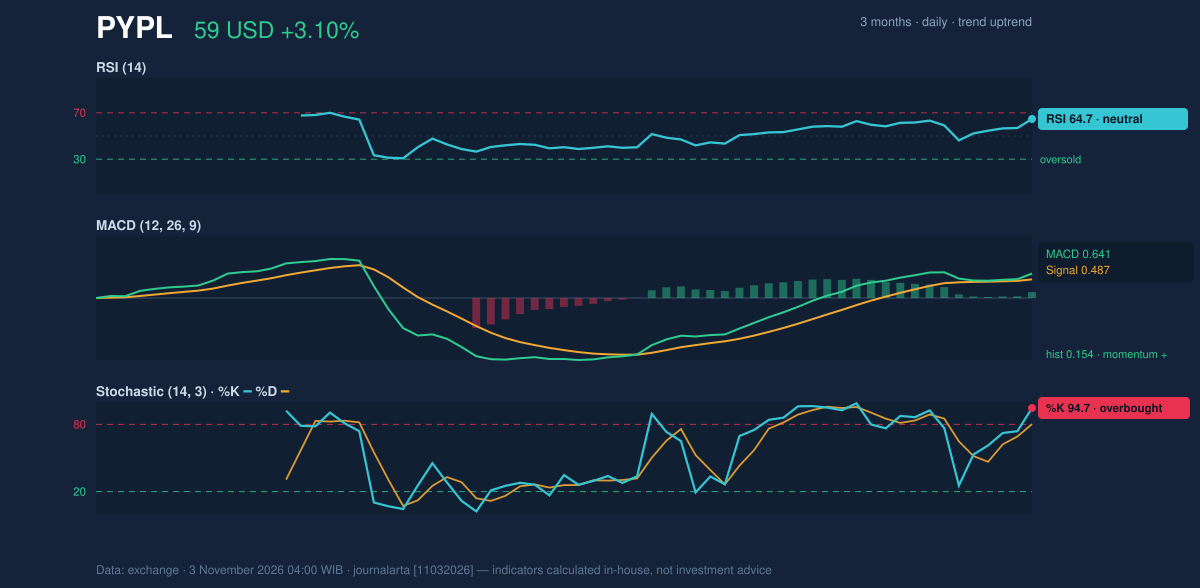
Volatility & Volume
PayPal closed above the upper Bollinger Band, $58.41, with %B at 109%. Bollinger Bands are a volatility measure built around a moving average; a close above the upper band can mark a forceful breakout, but also means the price has moved beyond its recent statistical range. The band width is 7.1% and described as narrowing, a squeeze that can precede a larger move. Here, the close above the band suggests the squeeze has resolved upward, but does not establish that the breakout will persist. Volume was 14,877,100 shares, against a 20-day average of 11,801,900, while OBV was rising. OBV tracks whether volume is flowing more heavily on rising or falling sessions; its upward direction supports the case that participation is confirming the price move. ATR, a gauge of typical price movement, was $1.43, or 2.4% of the share price—moderate volatility. The 3.10% daily advance was about 1.3 times that range, underscoring the strength of the session while showing that the move was larger than a typical daily fluctuation.Key Levels & Scenarios
Resistance is $58.78, the 20-day high and latest close; support is $54.61, the 20-day low. A sustained break above resistance would shift attention to the three-month high of $62.73. If the price instead retreats, $56.63—the price minus 1.5 times ATR—offers a nearer volatility-based reference, while a break below $54.61 would weaken the current technical picture.Technical Verdict: BUY
The data’s technical bias is bullish, supported by the golden cross formed three sessions before the latest session, the upward breakout above the upper Bollinger Band, and rising OBV. The main near-term caution is the overbought Stochastic at 94.7, which raises pullback risk without overturning those trend signals. This verdict is invalidated if the price falls below $54.61, the 20-day support. - Ideal entry range: $56.40–$58.78, anchored to the 20-day average and resistance. - Exit target: $62.73, the three-month high above the current 20-day resistance. - Stop-loss protection: $54.61, below the 20-day support. For non-traders, the indicators favor continued upward momentum, but a fall below $54.61 would undermine that reading. | Indicator | Latest reading | |---|---:| | Last price | $58.78 | | One-day / five-day / one-month change | 3.10% / 6.89% / 8.03% | | SMA20 / SMA50 | $56.40 / $55.31 | | RSI / Stochastic %K, %D | 64.7 / 94.7, 80.3 | | MACD / signal / histogram | 0.641 / 0.487 / 0.154 | | ATR(14) | $1.43 | | 20-day support / resistance | $54.61 / $58.78 | | Three-month low / high | $50.80 / $62.73 |Summary Data PYPL
| Last price | 58.78 USD |
| Change 1 day / 5 days / 1 month | 3.10% / 6.89% / 8.03% |
| Trend / MA-cross | uptrend / golden |
| SMA20 / SMA50 | 56.40 / 55.31 |
| RSI (14) / Stochastic %K | 64.7 / 94.7 |
| Bollinger %B / ATR | 109% / 1.43 |
| Support / Resistance 20 days | 54.61 / 58.78 |
| Data as of | 3 November 2026 04:00 WIB |
Disclaimer: This technical analysis is generated automatically from exchange data and indicators calculated by JournalArta, for information and education only. The verdict and the entry, target and stop-loss levels are not investment advice or a solicitation to buy or sell any security. Investment decisions and their risks rest solely with the reader.
Track PYPL stock price daily: live levels, support/resistance and our full PYPL analysis history.