Lloyds Stock Gains 1.84%, Momentum Weakens In Focus
On November 2, 2026: price 95.22 GBp, trend downtrend, RSI 34.4, support 93.50, resistance 105.85. technical analysis of lloyds stock. Lloyds Stock Gains —…

Trading data from the London Stock Exchange show Lloyds Banking Group rose 1.84% to 95.22 GBp on Monday, November 2, even as unusually heavy turnover accompanied a steep five-day decline. The session’s volume was 1.9 times its 20-day average, while the share remained below its key moving averages. The rebound was modest.
Why Lloyds is in focus today
- Volume at 1.9× the 20-day average
- Downtrend extending (5-day change -7.10%)
Selected automatically from 98 LSE (UK) stocks by a technical-signal score with daily weighted randomisation — not a recommendation.
Trend & Price Action
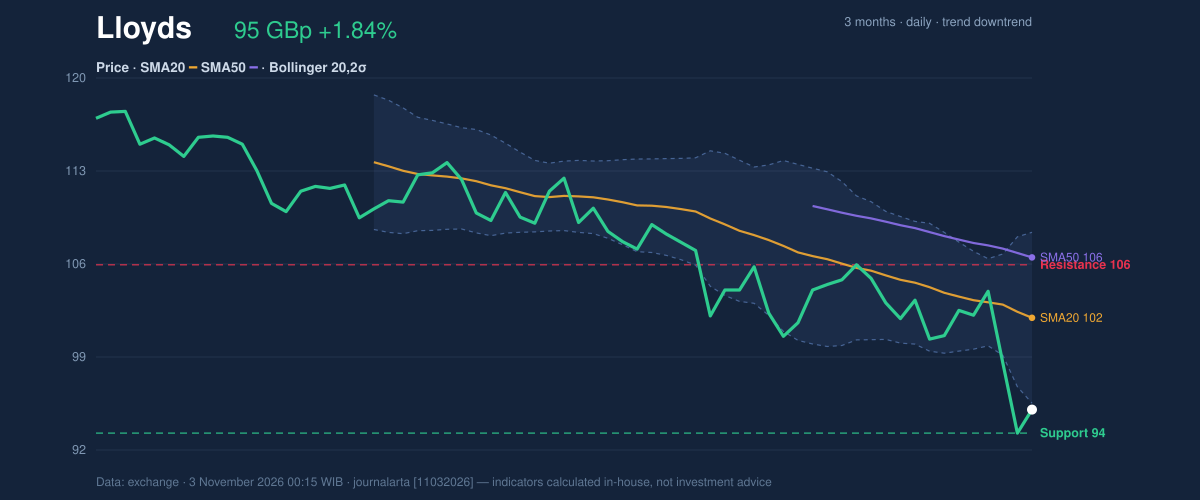
Lloyds gained from the previous close of 93.50 GBp, but the one-day rise sits against losses of 7.10% over five days and 8.44% over one month. The share is below its 20-day average of 101.96 and its 50-day average of 106.39, while the 20-day average itself fell 1.50% over five days. That combination points to a declining trend, not yet a confirmed change in direction. No new moving-average crossover has formed.
The closing price also sat below the lower Bollinger Band at 95.69, with %B at -4%. Bollinger Bands track how far a price moves from its recent average; a close below the lower band signals unusually weak positioning relative to that range, though it does not by itself establish that declines will continue. The band width was 12.3%, classified as normal, rather than indicating a particularly tight volatility squeeze. The stock was near the bottom of its 20-day range, between support at 93.50 and resistance at 105.85.
As shown in the chart, price is below both moving averages and just under the lower band, with support and resistance marking the near-term range.
Oscillators & Momentum
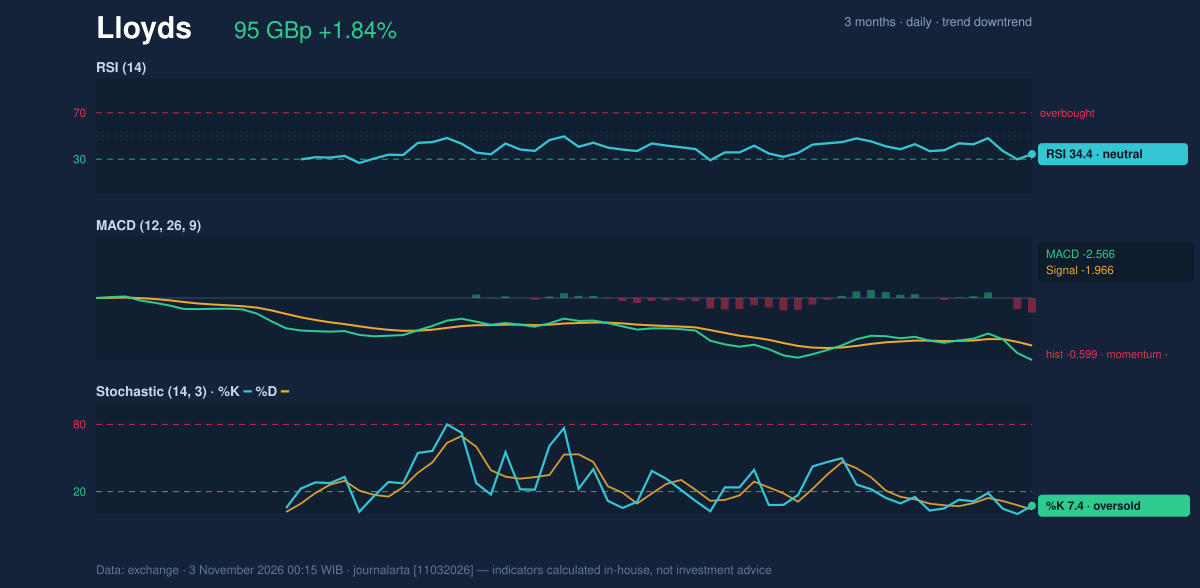
Momentum indicators add a mixed detail, but not yet a bullish confirmation. The RSI is 34.4, in neutral territory; the Relative Strength Index measures the pace of recent gains and losses, and this reading is weak without being at the conventional oversold threshold. The Stochastic is oversold, with %K at 7.4 and %D at 4.0, a sign that the price has fallen sharply within its recent range. Oversold readings can precede a bounce, but they are not evidence on their own that a downtrend has ended.
The MACD is negative at -2.566, below its -1.966 signal line, with a -0.599 histogram. The histogram has just turned negative, indicating that downside momentum has strengthened relative to the signal line. The chart brings these measures together: the Stochastic reflects stretched selling, while MACD remains aligned with the broader decline.
Volatility, Volume & Key Levels
Turnover of 313,836,399 shares, against a 20-day average of 167,798,484, shows that the decline has drawn greater-than-usual participation. On-balance volume (OBV), which tracks whether trading volume is flowing more with rising or falling sessions, is also down. That weakens the case that the latest rise represents broad accumulation: volume was elevated, but the underlying volume trend remains negative.
Average True Range, a measure of typical price movement, was 4.29 GBp, equivalent to 4.5% of the share price and signalling high volatility. The nearest technical reference points are 93.50 GBp support and 105.85 GBp resistance; the three-month low is 93.00 GBp. A break below the support area would expose the three-month low, while holding it could allow a rebound attempt toward resistance. Reaching resistance would still leave the price below the 20-day average at 101.96 only if it failed to regain that average along the way; a move through 105.85 would be a more substantial challenge to the current downtrend.
Technical Verdict: SELL
The technical bias is bearish. The strongest signals are the negative MACD histogram, the close below the lower Bollinger Band, and falling OBV alongside a downtrend confirmed by price below the 20- and 50-day averages. Oversold Stochastic readings point to the possibility of a short-term bounce, but do not outweigh those signals.
- Ideal entry range: 95.69–101.65 GBp, using the lower Bollinger Band and the reference level of price plus 1.5 times ATR.
- Exit target: 93.50 GBp, the 20-day support; the three-month low is 93.00 GBp.
- Stop-loss protection: 105.85 GBp, above the 20-day resistance.
The bearish reading is invalidated if the price breaks above 105.85 GBp. In plain English, the indicators favour continued weakness, although the oversold reading leaves room for a temporary rebound.
The London Stock Exchange data put Lloyds’ three-month low at 93.00 GBp.
Summary Data Lloyds
| Last price | 95.22 GBp |
| Change 1 day / 5 days / 1 month | 1.84% / -7.10% / -8.44% |
| Trend / MA-cross | downtrend / none |
| SMA20 / SMA50 | 101.96 / 106.39 |
| RSI (14) / Stochastic %K | 34.4 / 7.4 |
| Bollinger %B / ATR | -4% / 4.29 |
| Support / Resistance 20 days | 93.50 / 105.85 |
| Data as of | 3 November 2026 00:15 WIB |
Disclaimer: This technical analysis is generated automatically from exchange data and indicators calculated by JournalArta, for information and education only. The verdict and the entry, target and stop-loss levels are not investment advice or a solicitation to buy or sell any security. Investment decisions and their risks rest solely with the reader.
Track Lloyds share price daily: live levels, support/resistance and our full Lloyds analysis history.