Spirax Stock Analysis: Gains 1.67%, Testing Key Resistance
On November 2, 2026: price 7,600.00 GBp, trend uptrend, RSI 64.1, support 7,015.00, resistance 7,600.00. technical analysis of spirax stock.
Why Spirax is in focus today
- Closed at a 20-day high (7,600.00)
- Trading near its 3-month high (7,670.00)
- Breaking out of a Bollinger squeeze (band width 7.1%)
- Uptrend confirmed (5-day change 3.26%)
- Not covered by JournalArta in the last 14 days
Selected automatically from 98 LSE (UK) stocks by a technical-signal score with daily weighted randomisation — not a recommendation.
Trend & Price Action
The broader trend remains upward. The share is above its 20-day moving average of 7,335.75 GBp and 50-day average of 7,156.80 GBp, while the 20-day average rose 0.93% over five days. The gap between price and the shorter average suggests buyers have pushed the stock well above its recent trading norm. No new moving-average crossover has formed, however, so the trend is supported by price position rather than a fresh long-term confirmation. Spirax also closed at the 20-day resistance of 7,600.00 GBp, putting it at the top of the 20-day range and near the three-month peak. A close above the upper Bollinger Band contributed to the breakout signal, but it also means the price has moved beyond the band’s usual envelope. That can reflect strong demand; it can also leave the share vulnerable to a pause if fresh buying does not follow.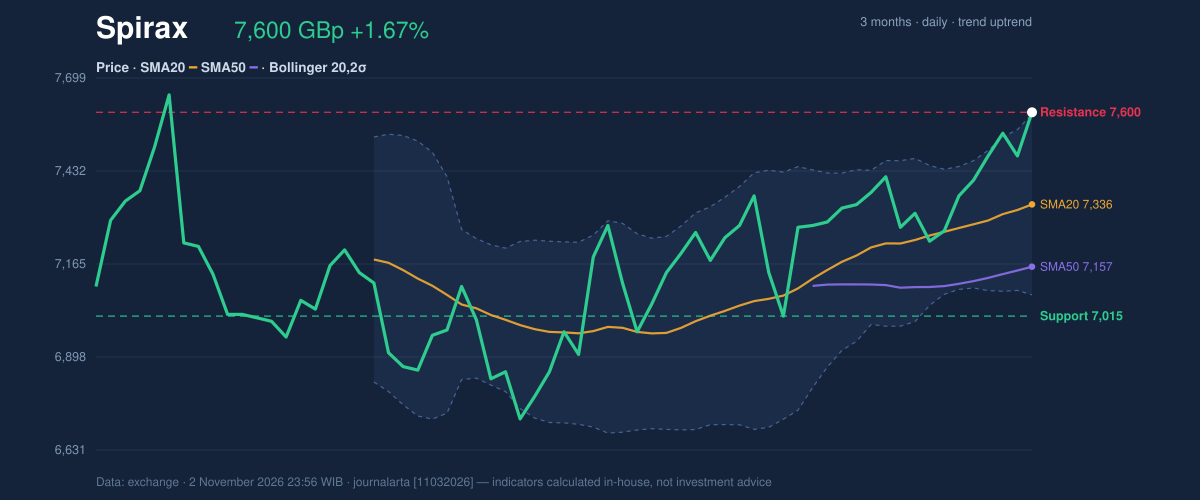
Oscillators & Momentum
Momentum indicators are positive, but not uniformly comfortable. The MACD is above its signal line, with a positive histogram, a configuration consistent with upward momentum. The relative strength index, or RSI, is 64.1 and classed as neutral in the supplied data: it points to firm momentum without yet signalling an overbought reading. The faster stochastic oscillator gives a more cautionary message. Its %K reading of 88.0 and %D of 81.0 are overbought, meaning the recent advance has been steep relative to the share’s recent price range. Overbought does not by itself predict a fall, but it raises the chance of consolidation if the stock struggles to clear resistance. The indicators therefore show an advance with positive underlying momentum, alongside a near-term risk of exhaustion.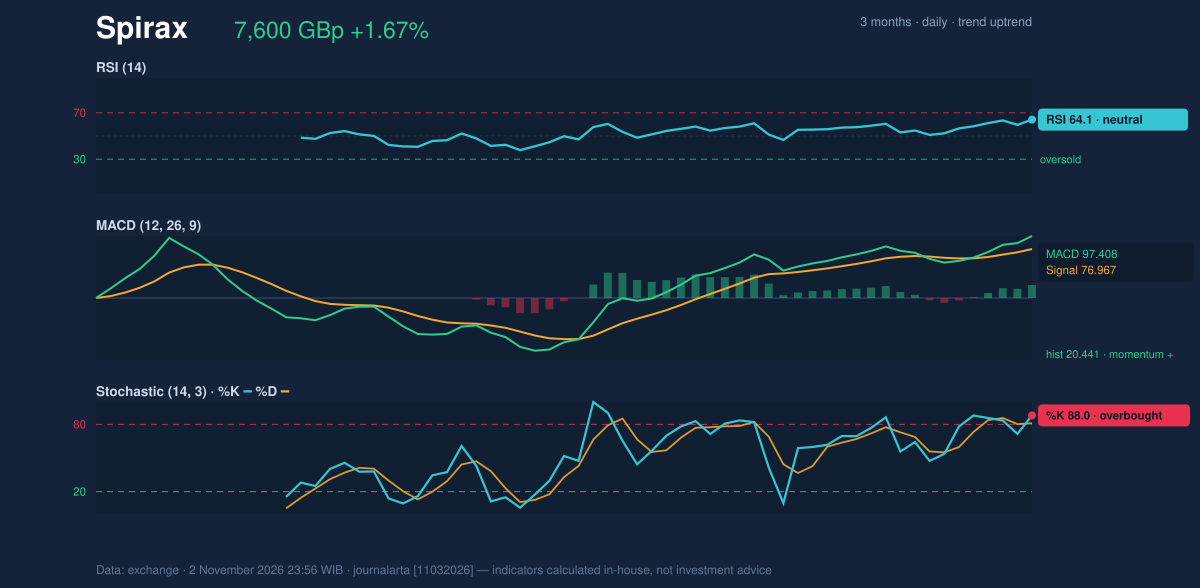
Volatility, Volume & Key Levels
The Bollinger Band width is 7.1%, described as a squeeze, or a period of narrowing bands that can precede a larger move. Spirax’s close above the upper band suggests that the range has begun to resolve upward. The signal is not yet reinforced by unusually heavy turnover: volume was 162,292 shares, compared with a 20-day average of 168,206, or 1.0 times normal. OBV, a measure of whether volume is accumulating on up days or down days, is rising, offering a second bullish confirmation even as trading activity remains around average. Average true range, which gauges typical price movement, stands at 156.57 GBp, or 2.1% of the share price—moderate volatility. The key near-term test is whether Spirax can hold above the 7,600.00 GBp resistance and approach the 7,670.00 GBp three-month high. Failure to sustain the breakout could bring the 7,365.15 GBp price-minus-1.5-ATR reference into view; deeper support sits at 7,015.00 GBp. The three-month low is 6,675.00 GBp.Technical Verdict: HOLD (wait & see)
A hold verdict matches the neutral technical bias. The upward trend, positive MACD and rising OBV support the advance, but the overbought stochastic and close at resistance argue against treating the breakout as established. Average volume also provides limited evidence of a surge in participation. - Ideal Entry Range: 7,335.75–7,600.00 GBp, bounded by the 20-day average and 20-day resistance. - Exit Target (Target Price): 7,670.00 GBp, the three-month high and next stated resistance beyond the 20-day ceiling. - Stop Loss protection: 7,015.00 GBp, below the 20-day support. The verdict is invalidated if the price falls below 7,015.00 GBp. In plain English, the chart shows an upward trend, but resistance and stretched short-term momentum leave the next move unconfirmed.| Metric | Reading |
|---|---|
| Last price | 7,600.00 GBp |
| One-day / five-day / one-month change | 1.67% / 3.26% / 4.47% |
| 20-day / 50-day moving average | 7,335.75 / 7,156.80 GBp |
| RSI / Stochastic | 64.1 / 88.0 (%K), 81.0 (%D) |
| MACD / signal / histogram | 97.408 / 76.967 / 20.441 |
| Support / resistance | 7,015.00 / 7,600.00 GBp |
Summary Data Spirax
| Last price | 7,600.00 GBp |
| Change 1 day / 5 days / 1 month | 1.67% / 3.26% / 4.47% |
| Trend / MA-cross | uptrend / none |
| SMA20 / SMA50 | 7,335.75 / 7,156.80 |
| RSI (14) / Stochastic %K | 64.1 / 88.0 |
| Bollinger %B / ATR | 101% / 156.57 |
| Support / Resistance 20 days | 7,015.00 / 7,600.00 |
| Data as of | 2 November 2026 23:56 WIB |
Disclaimer: This technical analysis is generated automatically from exchange data and indicators calculated by JournalArta, for information and education only. The verdict and the entry, target and stop-loss levels are not investment advice or a solicitation to buy or sell any security. Investment decisions and their risks rest solely with the reader.
Track Spirax share price daily: live levels, support/resistance and our full Spirax analysis history.